Supercuts 2003 Annual Report Download - page 26
Download and view the complete annual report
Please find page 26 of the 2003 Supercuts annual report below. You can navigate through the pages in the report by either clicking on the pages listed below, or by using the keyword search tool below to find specific information within the annual report.-
 1
1 -
2
-
3
-
4
-
5
-
6
-
7
-
8
-
9
-
10
-
11
-
12
-
13
-
14
-
15
-
 16
16 -
 17
17 -
 18
18 -
 19
19 -
 20
20 -
 21
21 -
 22
22 -
 23
23 -
 24
24 -
 25
25 -
 26
26 -
 27
27 -
 28
28 -
 29
29 -
 30
30 -
 31
31 -
 32
32 -
 33
33 -
 34
34 -
 35
35 -
 36
36 -
37
-
38
-
39
-
40
-
41
-
42
-
43
-
44
-
45
-
46
-
47
-
48
-
49
-
50
-
51
-
52
-
53
-
54
-
55
-
56
-
57
-
58
-
59
-
60
-
61
-
62
-
63
-
64
-
65
-
66
-
67
-
68
-
69
-
70
-
71
-
72
-
73
-
74
-
75
-
76
-
77
-
78
-
79
-
80
-
81
-
82
-
83
-
84
-
85
-
86
-
87
-
88
-
89
-
90
-
91
-
92
-
93
-
94
-
95
-
96
-
97
-
98
-
99
-
100
-
101
-
102
-
103
-
104
-
105
-
106
-
107
-
108
-
109
-
110
-
111
-
112
-
113
-
114
-
115
-
116
-
117
-
118
-
119
-
120
-
121
 |
 |

Table of Contents
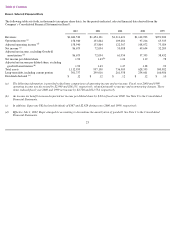
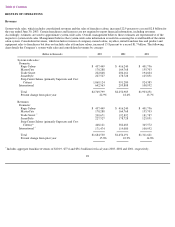
Item 6. Selected Financial Data
The following table sets forth, in thousands (except per share data), for the periods indicated, selected financial data derived from the
Company’s Consolidated Financial Statements in Item 8.
23
2003 2002 2001 2000 1999
Revenues
$
1,684,530
$
1,454,191
$
1,311,621
$
1,142,993
$
991,900
Operating income
(a)
158,940
133,864
109,281
97,216
65,335
Adjusted operating income
(d)
158,940
133,864
122,367
108,072
73,024
Net income
(a)
86,675
72,054
53,088
49,654
32,205
Adjusted net income, excluding Goodwill
amortization
(d)
86,675
72,054
61,954
57,395
38,432
Net income per diluted share
1.92
1.63
(b)
1.26
1.19
.78
Adjusted net income per diluted share, excluding
goodwill amortization
(d)
1.92
1.63
1.47
1.38
.93
Total assets
1,112,955
957,190
736,505
628,355
500,582
Long
-
term debt, including current portion
301,757
299,016
261,558
234,601
166,986
Dividends declared
(c)
$
.12
$
.12
$
.12
$
.12
$
.10
(a)
The following information is provided to facilitate comparisons of operating income and net income. Fiscal year 2000 and 1999
operating income was decreased by $2,940 and $16,133, respectively, related primarily to merger and restructuring charges. These
items reduced fiscal year 2000 and 1999 net income by $2,726 and $11,554, respectively.
(b)
An income tax benefit increased reported net income per diluted share by $.04 in fiscal year 2002. See Note 8 to the Consolidated
Financial Statements.
(c)
In addition, Supercuts UK declared dividends of $367 and $2,829 during years 2000 and 1999, respectively.
(d)
Effective July 1, 2001, Regis changed its accounting to discontinue the amortization of goodwill. See Note 1 to the Consolidated
Financial Statements.