Supercuts 2003 Annual Report Download - page 77
Download and view the complete annual report
Please find page 77 of the 2003 Supercuts annual report below. You can navigate through the pages in the report by either clicking on the pages listed below, or by using the keyword search tool below to find specific information within the annual report.-
 1
1 -
2
-
3
-
4
-
5
-
6
-
7
-
8
-
9
-
10
-
11
-
12
-
13
-
14
-
15
-
16
-
17
-
18
-
19
-
20
-
21
-
22
-
23
-
24
-
25
-
26
-
27
-
28
-
29
-
30
-
31
-
32
-
33
-
34
-
35
-
36
-
37
-
38
-
39
-
40
-
41
-
42
-
43
-
44
-
45
-
46
-
47
-
48
-
49
-
50
-
51
-
52
-
53
-
54
-
55
-
56
-
57
-
58
-
59
-
60
-
61
-
62
-
63
-
64
-
65
-
66
-
 67
67 -
 68
68 -
 69
69 -
 70
70 -
 71
71 -
 72
72 -
 73
73 -
 74
74 -
 75
75 -
 76
76 -
 77
77 -
 78
78 -
 79
79 -
 80
80 -
 81
81 -
 82
82 -
 83
83 -
 84
84 -
 85
85 -
 86
86 -
 87
87 -
88
-
89
-
90
-
91
-
92
-
93
-
94
-
95
-
96
-
97
-
98
-
99
-
100
-
101
-
102
-
103
-
104
-
105
-
106
-
107
-
108
-
109
-
110
-
111
-
112
-
113
-
114
-
115
-
116
-
117
-
118
-
119
-
120
-
121
 |
 |

Table of Contents
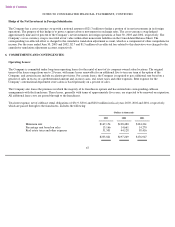
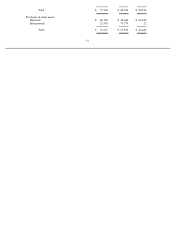
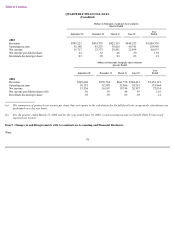
NOTES TO CONSOLIDATED FINANCIAL STATEMENTS, CONTINUED
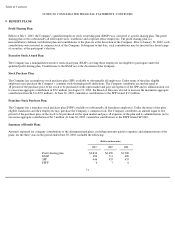
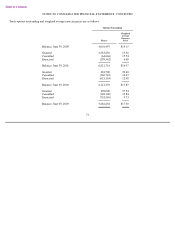
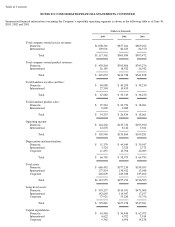
Stock options outstanding and weighted average exercise prices are as follows:
73
Options Outstanding
Weighted
Average
Exercise
Shares
Price
Balance, June 30, 2000
4,601,497
$
14.15
Granted
2,583,250
15.56
Cancelled
(64,666
)
15.54
Exercised
(298,362
)
6.68
Balance, June 30, 2001
6,821,719
$
14.97
Granted
301,500
29.60
Cancelled
(360,749
)
16.27
Exercised
(621,163
)
12.48
Balance, June 30, 2002
6,141,307
$
15.85
Granted
398,000
27.54
Cancelled
(128,100
)
19.84
Exercised
(724,569
)
9.73
Balance, June 30, 2003
5,686,638
$
17.30