Supercuts 2003 Annual Report Download - page 45
Download and view the complete annual report
Please find page 45 of the 2003 Supercuts annual report below. You can navigate through the pages in the report by either clicking on the pages listed below, or by using the keyword search tool below to find specific information within the annual report.-
 1
1 -
2
-
3
-
4
-
5
-
6
-
7
-
8
-
9
-
10
-
11
-
12
-
13
-
14
-
15
-
16
-
17
-
18
-
19
-
20
-
21
-
22
-
23
-
24
-
25
-
26
-
27
-
28
-
29
-
30
-
31
-
32
-
33
-
34
-
 35
35 -
 36
36 -
 37
37 -
 38
38 -
 39
39 -
 40
40 -
 41
41 -
 42
42 -
 43
43 -
 44
44 -
 45
45 -
 46
46 -
 47
47 -
 48
48 -
 49
49 -
 50
50 -
 51
51 -
 52
52 -
 53
53 -
 54
54 -
 55
55 -
56
-
57
-
58
-
59
-
60
-
61
-
62
-
63
-
64
-
65
-
66
-
67
-
68
-
69
-
70
-
71
-
72
-
73
-
74
-
75
-
76
-
77
-
78
-
79
-
80
-
81
-
82
-
83
-
84
-
85
-
86
-
87
-
88
-
89
-
90
-
91
-
92
-
93
-
94
-
95
-
96
-
97
-
98
-
99
-
100
-
101
-
102
-
103
-
104
-
105
-
106
-
107
-
108
-
109
-
110
-
111
-
112
-
113
-
114
-
115
-
116
-
117
-
118
-
119
-
120
-
121
 |
 |

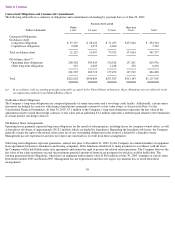
Table of Contents
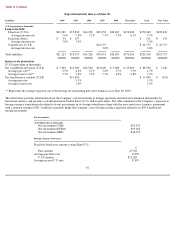
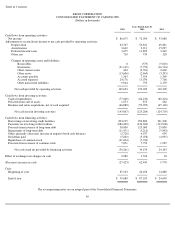
Expected maturity date as of June 30,
** Represents the average expected cost of borrowing for outstanding derivative balances as of June 30, 2003.
The table below provides information about the Company’s net investments in foreign operations and derivative financial instruments by
functional currency and presents such information in United States (U.S.) dollar equivalents. The table summarizes the Company’s exposure to
foreign currency translation risk related to its net investments in its foreign subsidiaries along with the associated cross-currency instrument
with a notional amount of $21.3 million to partially hedge the Company’s euro foreign currency exposure related to its $95.6 million net
foreign investment.
42
Liabilities 2004 2005 2006 2007 2008 Thereafter Total Fair Value
(U.S.$ equivalent in thousands)
Long-term debt:
Fixed rate (U.S.$)
$
21,089
$
15,830
$
14,238
$
28,158
$
20,867
$
170,200
$
270,382
$
278,841
Average interest rate
7.6
%
7.8
%
7.2
%
7.5
%
7.5
%
6.1
%
7.1
%
Fixed rate (Euro)
$
34
$
107
$
141
$
141
Average interest rate
7.0
%
7.0
%
7.0
%
Variable rate (U.S.$)
$
22,775
$
22,775
$
22,775
Average interest rate
3.8
%
3.8
%
Total liabilities
$
21,123
$
15,937
$
14,238
$
50,933
$
20,867
$
170,200
$
293,298
$
301,757
Interest rate derivatives
(U.S.$ equivalent in thousands)
Pay variable/receive fixed (U.S.$)
$
7,500
$
12,500
$
12,500
$
22,000
$
9,000
$
25,000
$
88,500
$
7,140
Average pay rate**
3.5
%
4.2
%
5.1
%
5.8
%
5.7
%
5.9
%
4.7
%
Average receive rate**
7.3
%
7.2
%
7.2
%
7.3
%
6.9
%
6.8
%
7.1
%
Pay fixed/receive variable (U.S.$)
$
11,800
$
11,800
$
(833
)
Average pay rate
5.1
%
5.1
%
Average receive rate
1.6
%
1.6
%
Net Investments:
(U.S.$ Equivalent in thousands)
Net investment (CND)
$
53,473
Net investment (EURO)
$
95,623
Net investment (GBP)
$
48,795
Foreign Currency Derivative:
Fixed
-
for
-
fixed cross currency swap (Euro/U.S.)
Euro amount
€
23,782
Average pay Euro rate
8.29
%
U.S.$ amount
$
21,284
Average receive U.S. rate
8.39
%