Supercuts 2003 Annual Report Download - page 61
Download and view the complete annual report
Please find page 61 of the 2003 Supercuts annual report below. You can navigate through the pages in the report by either clicking on the pages listed below, or by using the keyword search tool below to find specific information within the annual report.-
 1
1 -
2
-
3
-
4
-
5
-
6
-
7
-
8
-
9
-
10
-
11
-
12
-
13
-
14
-
15
-
16
-
17
-
18
-
19
-
20
-
21
-
22
-
23
-
24
-
25
-
26
-
27
-
28
-
29
-
30
-
31
-
32
-
33
-
34
-
35
-
36
-
37
-
38
-
39
-
40
-
41
-
42
-
43
-
44
-
45
-
46
-
47
-
48
-
49
-
50
-
 51
51 -
 52
52 -
 53
53 -
 54
54 -
 55
55 -
 56
56 -
 57
57 -
 58
58 -
 59
59 -
 60
60 -
 61
61 -
 62
62 -
 63
63 -
 64
64 -
 65
65 -
 66
66 -
 67
67 -
 68
68 -
 69
69 -
 70
70 -
 71
71 -
72
-
73
-
74
-
75
-
76
-
77
-
78
-
79
-
80
-
81
-
82
-
83
-
84
-
85
-
86
-
87
-
88
-
89
-
90
-
91
-
92
-
93
-
94
-
95
-
96
-
97
-
98
-
99
-
100
-
101
-
102
-
103
-
104
-
105
-
106
-
107
-
108
-
109
-
110
-
111
-
112
-
113
-
114
-
115
-
116
-
117
-
118
-
119
-
120
-
121
 |
 |

Table of Contents
NOTES TO CONSOLIDATED FINANCIAL STATEMENTS, CONTINUED
57
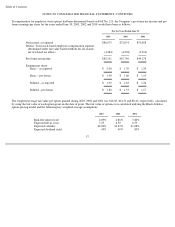
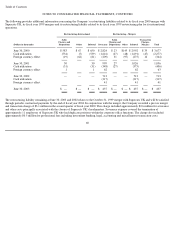
If compensation for employee stock options had been determined based on FAS No. 123, the Company’s pro forma net income and pro
forma earnings per share for the years ended June 30, 2003, 2002 and 2001 would have been as follows:
For the Years Ended June 30,
2003 2002 2001
Net income, as reported
$
86,675
$
72,054
$
53,088
Deduct: Total stock-based employee compensation expense
determined under fair value based methods for all awards,
net of related tax effects
(4,484
)
(4,258
)
(3,910
)
Pro forma net income
$
82,191
$
67,796
$
49,178
Earnings per share:
Basic
–
as reported
$
2.00
$
1.70
$
1.29
Basic
–
pro forma
$
1.90
$
1.60
$
1.19
Diluted
–
as reported
$
1.92
$
1.63
$
1.26
Diluted
–
pro forma
$
1.82
$
1.53
$
1.17
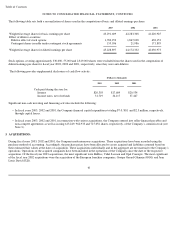
The weighted average fair value per option granted during 2003, 2002 and 2001 was $12.83, $14.31 and $8.43, respectively, calculated
by using the fair value of each option grant on the date of grant. The fair value of options was calculated utilizing the Black-Scholes
option
-
pricing model and the following key weighted average assumptions:
2003 2002 2001
Risk
-
free interest rate
2.89
%
4.86
%
5.80
%
Expected life in years
7.25
6.50
6.55
Expected volatility
42.00
%
43.27
%
41.08
%
Expected dividend yield
.45
%
.49
%
.83
%