Supercuts 2003 Annual Report Download - page 53
Download and view the complete annual report
Please find page 53 of the 2003 Supercuts annual report below. You can navigate through the pages in the report by either clicking on the pages listed below, or by using the keyword search tool below to find specific information within the annual report.-
 1
1 -
2
-
3
-
4
-
5
-
6
-
7
-
8
-
9
-
10
-
11
-
12
-
13
-
14
-
15
-
16
-
17
-
18
-
19
-
20
-
21
-
22
-
23
-
24
-
25
-
26
-
27
-
28
-
29
-
30
-
31
-
32
-
33
-
34
-
35
-
36
-
37
-
38
-
39
-
40
-
41
-
42
-
 43
43 -
 44
44 -
 45
45 -
 46
46 -
 47
47 -
 48
48 -
 49
49 -
 50
50 -
 51
51 -
 52
52 -
 53
53 -
 54
54 -
 55
55 -
 56
56 -
 57
57 -
 58
58 -
 59
59 -
 60
60 -
 61
61 -
 62
62 -
 63
63 -
64
-
65
-
66
-
67
-
68
-
69
-
70
-
71
-
72
-
73
-
74
-
75
-
76
-
77
-
78
-
79
-
80
-
81
-
82
-
83
-
84
-
85
-
86
-
87
-
88
-
89
-
90
-
91
-
92
-
93
-
94
-
95
-
96
-
97
-
98
-
99
-
100
-
101
-
102
-
103
-
104
-
105
-
106
-
107
-
108
-
109
-
110
-
111
-
112
-
113
-
114
-
115
-
116
-
117
-
118
-
119
-
120
-
121
 |
 |

Table of Contents
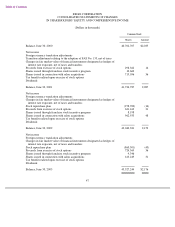
REGIS CORPORATION
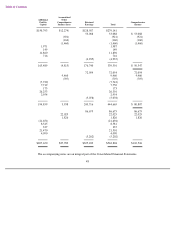
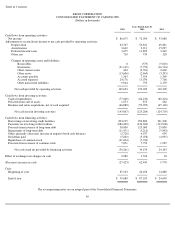
CONSOLIDATED STATEMENT OF CASH FLOWS
(Dollars in thousands)
The accompanying notes are an integral part of the Consolidated Financial Statements.
49
Years Ended June 30,
2003 2002 2001
Cash flows from operating activities:
Net income
$
86,675
$
72,054
$
53,088
Adjustments to reconcile net income to net cash provided by operating activities:
Depreciation
63,767
56,821
49,821
Amortization
3,632
2,911
15,097
Deferred income taxes
3,475
11,890
3,249
Other, net
710
739
120
Changes in operating assets and liabilities:
Receivables
8
(575
)
(5,010
)
Inventories
(31,145
)
(7,759
)
(16,724
)
Other current assets
624
(2,761
)
2,669
Other assets
(13,606
)
(2,460
)
(3,295
)
Accounts payable
1,363
7,354
1,369
Accrued expenses
24,176
13,070
7,766
Other noncurrent liabilities
9,944
755
2,159
Net cash provided by operating activities
149,623
152,039
110,309
Cash flows from investing activities:
Capital expenditures
(77,460
)
(66,232
)
(80,224
)
Proceeds from sale of assets
1,273
873
682
Business and salon acquisitions, net of cash acquired
(66,880
)
(59,925
)
(45,165
)
Net cash used in investing activities
(143,067
)
(125,284
)
(124,707
)
Cash flows from financing activities:
Borrowings on revolving credit facilities
854,195
250,800
321,200
Payments on revolving credit facilities
(886,420
)
(336,300
)
(313,900
)
Proceeds from issuance of long
-
term debt
30,000
125,000
25,000
Repayments of long
-
term debt
(11,471
)
(5,212
)
(5,942
)
Other, primarily (decrease) increase in negative book cash balances
(2,720
)
4,937
695
Dividends paid
(5,202
)
(5,078
)
(4,935
)
Repurchase of common stock
(21,694
)
(7,743
)
Proceeds from issuance of common stock
7,051
7,750
1,987
Net cash (used in) provided by financing activities
(36,261
)
34,154
24,105
Effect of exchange rate changes on cash
2,282
1,536
63
(Decrease) increase in cash
(27,423
)
62,445
9,770
Cash:
Beginning of year
87,103
24,658
14,888
End of year
$
59,680
$
87,103
$
24,658