Starbucks 2000 Annual Report Download - page 8
Download and view the complete annual report
Please find page 8 of the 2000 Starbucks annual report below. You can navigate through the pages in the report by either clicking on the pages listed below, or by using the keyword search tool below to find specific information within the annual report.-
 1
1 -
 2
2 -
 3
3 -
 4
4 -
 5
5 -
 6
6 -
 7
7 -
 8
8 -
 9
9 -
 10
10 -
 11
11 -
 12
12 -
 13
13 -
 14
14 -
 15
15 -
 16
16 -
 17
17 -
 18
18 -
 19
19 -
20
-
21
-
22
-
23
-
24
-
25
-
26
-
27
-
28
-
29
-
30
-
31
-
32
-
33
-
34
-
35
-
36
 |
 |

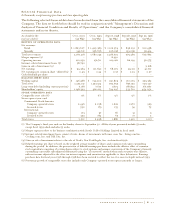
Gross Margin
Gross margin increased to 56.0% of net revenues for fiscal 2000 from 55.9% in fiscal 1999. The
positive impact on gross margin of lower green coffee costs and retail beverage sales price increases was
partially offset by higher retail occupancy costs. Occupancy costs, which are primarily fixed costs, were
higher as a percentage of revenue due, in part, to one less week of sales in fiscal 2000. Also, occupancy
costs have increased as a result of higher average rent expense per square foot as well as the expansion of
Company-operated stores into international markets that have higher occupancy costs as a percentage of
revenue than North American retail operations.
Joint Venture Income
The Company has two joint ventures to produce and distribute Starbucks branded products. The North
American Coffee Partnership is a 50/50 joint venture partnership with the Pepsi-Cola Company to
develop and distribute bottled Frappuccino®coffee drink. The Starbucks Ice Cream Partnership is
a 50/50 joint venture partnership with Dreyer’s Grand Ice Cream, Inc. to develop and distribute
premium ice creams.
The Company is a partner in several other joint ventures that operate licensed Starbucks retail stores,
including Starbucks Coffee Japan Limited, a 50/50 joint venture partnership with a Japanese retailer
and restauranteur, SAZABY Inc., to develop Starbucks retail stores in Japan.
Joint venture income was $20.3 million for fiscal 2000, compared to $3.2 million for fiscal 1999.
The increase was primarily due to the crossover from losses to profitability of Starbucks Coffee Japan
Limited as a result of an increase in scale, and due to the improved profitability of the North American
Coffee Partnership.
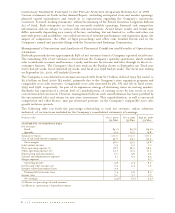
Expenses
Store operating expenses as a percentage of retail revenues increased to 38.7% for fiscal 2000 from 38.2%
for fiscal 1999. The increase was due to a number of factors. Higher average wage rates combined with a
continuing shift in retail sales to more labor-intensive handcrafted beverages resulted in higher payroll-
related expenditures. This shift in retail sales mix also resulted in increased maintenance on store equipment.
Provision for losses on asset disposals increased due to store remodel costs associated with the expansion of
lunch programs and computer system upgrades. These increases were partially offset by leverage gained from
retail beverage sales price increases and reductions in advertising expenses.
Other operating expenses (expenses associated with all operations other than Company-operated retail
stores) were 22.7% of specialty revenues during fiscal 2000, compared to 21.3% for fiscal 1999. This
increase was primarily due to higher payroll-related expenditures for accelerating the growth of the
Company’s specialty businesses.
Depreciation and amortization was 6.0% of net revenues, compared to 5.8% of net revenues for fiscal
1999. Excluding the extra week of sales in fiscal 1999, depreciation and amortization would have been
5.9% of net revenues in fiscal 1999.
General and administrative expenses were 5.1% of net revenues during fiscal 2000, compared to 5.3%
for fiscal 1999 primarily due to lower payroll-related expenses as a percentage of net revenues.
P. 24 starbucks coffee company