Starbucks 2000 Annual Report Download - page 15
Download and view the complete annual report
Please find page 15 of the 2000 Starbucks annual report below. You can navigate through the pages in the report by either clicking on the pages listed below, or by using the keyword search tool below to find specific information within the annual report.-
 1
1 -
2
-
3
-
4
-
 5
5 -
 6
6 -
 7
7 -
 8
8 -
 9
9 -
 10
10 -
 11
11 -
 12
12 -
 13
13 -
 14
14 -
 15
15 -
 16
16 -
 17
17 -
 18
18 -
 19
19 -
 20
20 -
 21
21 -
 22
22 -
 23
23 -
 24
24 -
 25
25 -
26
-
27
-
28
-
29
-
30
-
31
-
32
-
33
-
34
-
35
-
36
 |
 |

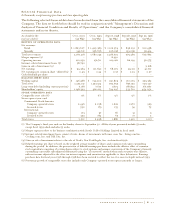
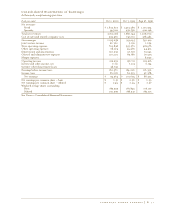
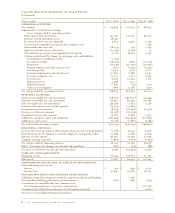
Consolidated Statements of Earnings
In thousands, except earnings per share
Fiscal year ended Oct 1, 2000 Oct 3, 1999 Sept 27, 1998
Net revenues:
Retail $ 1,823,607 $ 1,423,389 $ 1,102,574
Specialty 345,611 256,756 206,128
Total net revenues 2,169,218 1,680,145 1,308,702
Cost of sales and related occupancy costs 953,560 741,010 578,483
Gross margin 1,215,658 939,135 730,219
Joint venture income 20,300 3,192 1,034
Store operating expenses 704,898 543,572 418,476
Other operating expenses 78,374 54,566 44,513
Depreciation and amortization 130,232 97,797 72,543
General and administrative expenses 110,202 89,681 77,575
Merger expenses - - 8,930
Operating income 212,252 156,711 109,216
Interest and other income, net 7,110 7,315 7,134
Internet-related investment losses 58,792 - -
Earnings before income taxes 160,570 164,026 116,350
Income taxes 66,006 62,333 47,978
Net earnings $ 94,564 $ 101,693 $ 68,372
Net earnings per common share — basic $ 0.51 $ 0.56 $ 0.39
Net earnings per common share — diluted $ 0.49 $ 0.54 $ 0.37
Weighted average shares outstanding:
Basic 185,595 181,842 176,110
Diluted 192,999 188,531 183,771
See Notes to Consolidated Financial Statements.
starbucks coffee company P. 31