Starbucks 2000 Annual Report Download - page 5
Download and view the complete annual report
Please find page 5 of the 2000 Starbucks annual report below. You can navigate through the pages in the report by either clicking on the pages listed below, or by using the keyword search tool below to find specific information within the annual report.-
 1
1 -
 2
2 -
 3
3 -
 4
4 -
 5
5 -
 6
6 -
 7
7 -
 8
8 -
 9
9 -
 10
10 -
 11
11 -
 12
12 -
 13
13 -
 14
14 -
 15
15 -
 16
16 -
17
-
18
-
19
-
20
-
21
-
22
-
23
-
24
-
25
-
26
-
27
-
28
-
29
-
30
-
31
-
32
-
33
-
34
-
35
-
36
 |
 |

starbucks coffee company P. 21
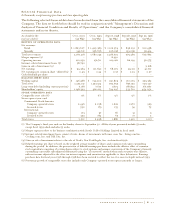
Selected Financial Data
In thousands, except earnings per share and store operating data
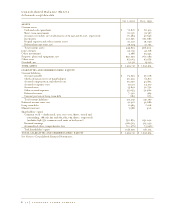
The following selected financial data have been derived from the consolidated financial statements of the
Company. The data set forth below should be read in conjunction with “Management’s Discussion and
Analysis of Financial Condition and Results of Operations” and the Company’s consolidated financial
statements and notes thereto.
As of and for the Oct 1, 2000 Oct 3, 1999 Sept 27, 1998 Sept 28, 1997 Sept 29, 1996
fiscal year ended (1) (52 Wks) (53 Wks) (52 Wks) (52 Wks) (52 Wks)
RESULTS OF OPERATIONS DATA
Net revenues:
Retail $ 1,823,607 $ 1,423,389 $ 1,102,574 $ 836,291 $ 601,458
Specialty 345,611 256,756 206,128 139,098 96,414
Total net revenues 2,169,218 1,680,145 1,308,702 975,389 697,872
Merger expenses (2) - - 8,930 - -
Operating income 212,252 156,711 109,216 86,199 56,575
Internet-related investment losses (3) 58,792 - - - -
Gain on sale of investment (4) - - - - 9,218
Net earnings $ 94,564 $ 101,693 $ 68,372 $ 55,211 $ 41,710
Net earnings per common share -diluted (5) $ 0.49 $ 0.54 $ 0.37 $ 0.33 $ 0.27
Cash dividends per share - - - - -
BALANCE SHEET DATA
Working capital $ 146,568 $ 135,303 $ 157,805 $ 172,079 $ 239,365
Total assets 1,493,131 1,252,514 992,755 857,152 729,227
Long-term debt (including current portion) 7,168 7,691 1,803 168,832 167,980
Shareholders’ equity 1,148,399 961,013 794,297 533,710 454,050
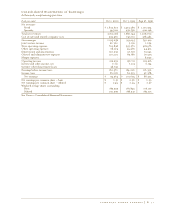
STORE OPERATING DATA
Comparable store sales (6) 9% 6% 5% 5% 7%
Stores open at year-end:
Continental North America:
Company-operated stores 2,446 2,038 1,622 1,270 929
Licensed stores 530 179 133 94 75
International:
Company-operated stores 173 97 66 31 9
Licensed stores 352 184 65 17 2
Total stores 3,501 2,498 1,886 1,412 1,015
(1) The Company’s fiscal year ends on the Sunday closest to September 30. All fiscal years presented include 52 weeks,
except fiscal 1999 which includes 53 weeks.
(2) Merger expenses relate to the business combination with Seattle Coffee Holdings Limited in fiscal 1998.
(3) Internet-related investment losses consist of write-downs of investments in Kozmo.com, Inc., living.com Inc.,
Cooking.com, Inc. and Talk City, Inc.
(4) Gain on sale of investment relates to the sale of Noah’s New York Bagels, Inc. stock in fiscal 1996.
(5) Diluted earnings per share is based on the weighted average number of shares and common stock units outstanding
during the period. In addition, the presentation of diluted earnings per share includes the dilutive effect of common
stock equivalents consisting of certain shares subject to stock options and assumes conversion of the Company’s formerly
outstanding convertible subordinated debentures using the “if converted” method when such securities were dilutive,
with net income adjusted for the after-tax interest expense and amortization applicable to these debentures. Earnings
per share data for fiscal years 1996 through 1998 have been restated to reflect the two-for-one stock split in fiscal 1999.
(6) Percentage growth of comparable store sales includes only Company-operated stores open 13 months or longer.