Starbucks 2000 Annual Report Download - page 32
Download and view the complete annual report
Please find page 32 of the 2000 Starbucks annual report below. You can navigate through the pages in the report by either clicking on the pages listed below, or by using the keyword search tool below to find specific information within the annual report.-
 1
1 -
2
-
3
-
4
-
5
-
6
-
7
-
8
-
9
-
10
-
11
-
12
-
13
-
14
-
15
-
16
-
17
-
18
-
19
-
20
-
21
-
 22
22 -
 23
23 -
 24
24 -
 25
25 -
 26
26 -
 27
27 -
 28
28 -
 29
29 -
 30
30 -
 31
31 -
 32
32 -
 33
33 -
 34
34 -
 35
35 -
 36
36
 |
 |

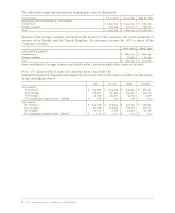
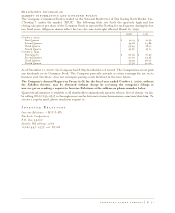
The tables below represent information by geographic area (in thousands):
Fiscal year ended Oct 1, 2000 Oct 3, 1999 Sept 27, 1998
REVENUES FROM EXTERNAL CUSTOMERS:
United States $ 1,940,723 $ 1,490,133 $ 1,173,982
Foreign countries 228,495 190,012 134,720
Total $ 2,169,218 $ 1,680,145 $ 1,308,702
Revenues from foreign countries are based on the location of the customers and consist primarily of
revenues from Canada and the United Kingdom. No customer accounts for 10% or more of the
Company’s revenues.
Oct 1, 2000 Oct 3, 1999
LONG-LIVED ASSETS:
United States $ 819,200 $ 680,344
Foreign countries 111,559 79,945
Total $ 930,759 $ 760,289
Assets attributed to foreign countries are based on the country in which those assets are located.
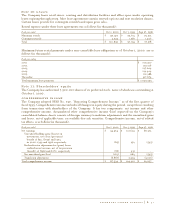
Note 17: Quarterly financial information (unaudited)
Summarized quarterly financial information for fiscal years 2000 and 1999 is as follows (in thousands,
except earnings per share):
FIRST SECOND THIRD FOURTH
2000 quarter:
Net revenues $ 526,982 $ 504,698 $ 555,546 $ 581,992
Gross margin 288,580 281,449 314,420 331,209
Net earnings 34,749 23,406 34,913 1,496
Net earnings per common share — diluted $ 0.18 $ 0.12 $ 0.18 $ 0.01
1999 quarter:
Net revenues $ 405,638 $ 375,822 $ 423,792 $ 474,893
Gross margin 219,338 205,865 238,772 275,160
Net earnings 26,733 17,957 24,635 32,368
Net earnings per common share — diluted $ 0.14 $ 0.10 $ 0.13 $ 0.17
P. 48 starbucks coffee company