Starbucks 2000 Annual Report Download - page 16
Download and view the complete annual report
Please find page 16 of the 2000 Starbucks annual report below. You can navigate through the pages in the report by either clicking on the pages listed below, or by using the keyword search tool below to find specific information within the annual report.-
 1
1 -
2
-
3
-
4
-
5
-
 6
6 -
 7
7 -
 8
8 -
 9
9 -
 10
10 -
 11
11 -
 12
12 -
 13
13 -
 14
14 -
 15
15 -
 16
16 -
 17
17 -
 18
18 -
 19
19 -
 20
20 -
 21
21 -
 22
22 -
 23
23 -
 24
24 -
 25
25 -
 26
26 -
27
-
28
-
29
-
30
-
31
-
32
-
33
-
34
-
35
-
36
 |
 |

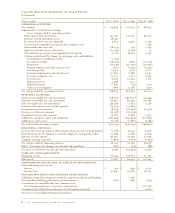
Consolidated Statements of Cash Flows
In thousands
Fiscal year ended Oct 1, 2000 Oct 3, 1999 Sept 27, 1998
OPERATING ACTIVITIES:
Net earnings $ 94,564 $ 101,693 $ 68,372
Adjustments to reconcile net earnings
to net cash provided by operating activities:
Depreciation and amortization 142,171 107,512 80,901
Internet-related investment losses 58,792 - -
Provision for losses on asset disposals 5,753 2,456 7,234
Conversion of compensatory options into common stock - - 1,158
Deferred income taxes, net (18,252) 794 2,125
Equity in (income) losses of investees (15,139) (2,318) 14
Tax benefit from exercise of nonqualified stock options 31,131 18,621 9,332
Cash provided (used) by changes in operating assets and liabilities:
Net purchases of trading securities (1,414) - -
Accounts receivable (28,235) 3,838 (19,790)
Inventories (19,495) (36,405) (23,496)
Prepaid expenses and other current assets (700) (7,552) (2,497)
Accounts payable 15,561 4,711 4,601
Accrued compensation and related costs 30,962 7,586 9,943
Accrued occupancy costs 6,007 5,517 5,342
Accrued taxes 5,026 12,429 7,173
Minority interest 3,188 400 -
Deferred revenue 6,836 (53) 209
Other accrued expenses 1,818 10,366 1,590
Net cash provided by operating activities 318,574 229,595 152,211
INVESTING ACTIVITIES:
Purchase of available-for-sale investments (118,501) (122,800) (51,354)
Maturity of available-for-sale investments 58,750 85,053 112,080
Sale of available-for-sale investments 49,238 3,633 5,138
Purchase of businesses, net of cash acquired (13,522) (15,662) -
Investments in joint ventures (8,473) (10,466) (12,418)
Purchases of other investments (35,457) (20,314) -
Distributions from joint ventures 14,279 8,983 2,750
Additions to property, plant and equipment (316,450) (257,854) (201,855)
Additions to other assets (3,096) (6,866) (3,184)
Net cash used by investing activities (373,232) (336,293) (148,843)
FINANCING ACTIVITIES:
Increase/(decrease) in cash provided by checks drawn in excess of bank balances (7,479) 29,512 4,846
Proceeds from sale of common stock under employee stock purchase plan 10,258 9,386 4,649
Exercise of stock options 58,463 33,799 20,755
Payments on long-term debt (1,889) (1,189) (1,993)
Net cash provided by financing activities 59,353 71,508 28,257
Effect of exchange rate changes on cash and cash equivalents (297) (54) (88)
Net increase/(decrease) in cash and cash equivalents 4,398 (35,244) 31,537
CASH AND CASH EQUIVALENTS:
Beginning of year 66,419 101,663 70,126
End of year $ 70,817 $ 66,419 $ 101,663
SUPPLEMENTAL DISCLOSURE OF CASH FLOW INFORMATION:
Cash paid during the year for:
Interest $ 411 $ 442 $ 4,130
Income taxes 51,856 35,366 32,643
NONCASH FINANCING AND INVESTING TRANSCATIONS:
Liabilities assumed in conjunction with the acquisition of land and building - 7,746 -
Net unrealized holding gains (losses) on investments (163) 683 (595)
Conversion of convertible debt into common stock,
net of unamortized issue costs and accrued interest - - 162,036
Common stock tendered in settlement of stock options exercised - - 4,859
See Notes to Consolidated Financial Statements.
P. 32 starbucks coffee company