Singapore Airlines 2013 Annual Report Download - page 81
Download and view the complete annual report
Please find page 81 of the 2013 Singapore Airlines annual report below. You can navigate through the pages in the report by either clicking on the pages listed below, or by using the keyword search tool below to find specific information within the annual report.-
 1
1 -
2
-
3
-
4
-
5
-
6
-
7
-
8
-
9
-
10
-
11
-
12
-
13
-
14
-
15
-
16
-
17
-
18
-
19
-
20
-
21
-
22
-
23
-
24
-
25
-
26
-
27
-
28
-
29
-
30
-
31
-
32
-
33
-
34
-
35
-
36
-
37
-
38
-
39
-
40
-
41
-
42
-
43
-
44
-
45
-
46
-
47
-
48
-
49
-
50
-
51
-
52
-
53
-
54
-
55
-
56
-
57
-
58
-
59
-
60
-
61
-
62
-
63
-
64
-
65
-
66
-
67
-
68
-
69
-
70
-
 71
71 -
 72
72 -
 73
73 -
 74
74 -
 75
75 -
 76
76 -
 77
77 -
 78
78 -
 79
79 -
 80
80 -
 81
81 -
 82
82 -
 83
83 -
 84
84 -
 85
85 -
 86
86 -
 87
87 -
 88
88 -
 89
89 -
 90
90 -
 91
91 -
92
-
93
-
94
-
95
-
96
-
97
-
98
-
99
-
100
-
101
-
102
-
103
-
104
-
105
-
106
-
107
-
108
-
109
-
110
-
111
-
112
-
113
-
114
-
115
-
116
-
117
-
118
-
119
-
120
-
121
-
122
-
123
-
124
-
125
-
126
-
127
-
128
-
129
-
130
-
131
-
132
-
133
-
134
-
135
-
136
-
137
-
138
-
139
-
140
-
141
-
142
-
143
-
144
-
145
-
146
-
147
-
148
-
149
-
150
-
151
-
152
-
153
-
154
-
155
-
156
-
157
-
158
-
159
-
160
-
161
-
162
-
163
-
164
-
165
-
166
-
167
-
168
-
169
-
170
-
171
-
172
-
173
-
174
-
175
-
176
-
177
-
178
-
179
-
180
-
181
-
182
-
183
-
184
-
185
-
186
-
187
-
188
-
189
-
190
-
191
-
192
-
193
-
194
-
195
-
196
-
197
-
198
-
199
-
200
-
201
-
202
-
203
-
204
-
205
-
206
-
207
-
208
-
209
-
210
 |
 |

079
ANNUAL REPORT 2012/13
Performance of the Subsidiary Companies
The major subsidiary companies are SIA Engineering Company Limited (“SIAEC”), SIA Cargo and SilkAir (Singapore) Private
Limited (“SilkAir”). The following performance review includes intra-group transactions.
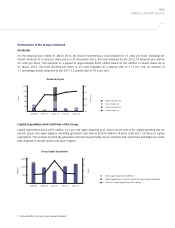
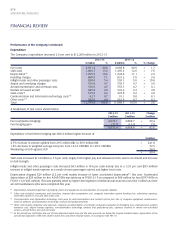
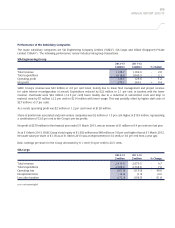
SIA Engineering Group
2012-13 2011-12
$ million $ million % Change
Total revenue 1,146.7 1,169.9 - 2.0
Total expenditure 1,018.6 1,040.3 - 2.1
Operating profit 128.1 129.6 - 1.2
Net profit 270.1 269.1 + 0.4
SIAEC Group’s revenue was $23 million or 2.0 per cent lower, mainly due to lower fleet management and project revenue
for cabin interior reconfiguration of aircraft. Expenditure reduced by $22 million or 2.1 per cent, in tandem with the lower
revenue. Overheads were $44 million (-12.5 per cent) lower mainly due to a reduction in subcontract costs and drop in
material costs by $5 million (-2.2 per cent) to $214 million with lower usage. This was partially offset by higher staff costs of
$27 million (+5.7 per cent).
As a result, operating profit was $2 million or 1.2 per cent lower at $128 million.
Share of profits from associated and joint venture companies was $2 million or 1.5 per cent higher at $159 million, representing
a contribution of 52.0 per cent to the Group’s pre-tax profits.
Net profit of $270 million for the financial year ended 31 March 2013, was an increase of $1 million or 0.4 per cent over last year.
As at 31 March 2013, SIAEC Group’s total equity of $1,302 million was $48 million or 3.8 per cent higher than at 31 March 2012.
Net asset value per share of $1.18 as at 31 March 2013 was an improvement of 3.4 cents or 3.0 per cent from a year ago.
Basic earnings per share for the Group decreased by 0.1 cent (-0.4 per cent) to 24.5 cents.
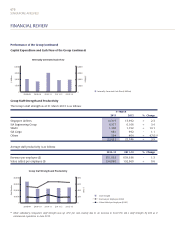
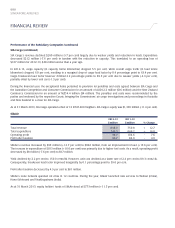
SIA Cargo
2012-13 2011-12
$ million $ million % Change
Total revenue 2,419.6 2,679.5 - 9.7
Total expenditure 2,586.6 2,798.8 - 7.6
Operating loss (167.0) (119.3) - 40.0
Exceptional items (19.9) (1.3) n.m
Loss after taxation (172.3) (106.5) - 61.8
n.m. not meaningful