Singapore Airlines 2013 Annual Report Download - page 196
Download and view the complete annual report
Please find page 196 of the 2013 Singapore Airlines annual report below. You can navigate through the pages in the report by either clicking on the pages listed below, or by using the keyword search tool below to find specific information within the annual report.-
 1
1 -
2
-
3
-
4
-
5
-
6
-
7
-
8
-
9
-
10
-
11
-
12
-
13
-
14
-
15
-
16
-
17
-
18
-
19
-
20
-
21
-
22
-
23
-
24
-
25
-
26
-
27
-
28
-
29
-
30
-
31
-
32
-
33
-
34
-
35
-
36
-
37
-
38
-
39
-
40
-
41
-
42
-
43
-
44
-
45
-
46
-
47
-
48
-
49
-
50
-
51
-
52
-
53
-
54
-
55
-
56
-
57
-
58
-
59
-
60
-
61
-
62
-
63
-
64
-
65
-
66
-
67
-
68
-
69
-
70
-
71
-
72
-
73
-
74
-
75
-
76
-
77
-
78
-
79
-
80
-
81
-
82
-
83
-
84
-
85
-
86
-
87
-
88
-
89
-
90
-
91
-
92
-
93
-
94
-
95
-
96
-
97
-
98
-
99
-
100
-
101
-
102
-
103
-
104
-
105
-
106
-
107
-
108
-
109
-
110
-
111
-
112
-
113
-
114
-
115
-
116
-
117
-
118
-
119
-
120
-
121
-
122
-
123
-
124
-
125
-
126
-
127
-
128
-
129
-
130
-
131
-
132
-
133
-
134
-
135
-
136
-
137
-
138
-
139
-
140
-
141
-
142
-
143
-
144
-
145
-
146
-
147
-
148
-
149
-
150
-
151
-
152
-
153
-
154
-
155
-
156
-
157
-
158
-
159
-
160
-
161
-
162
-
163
-
164
-
165
-
166
-
167
-
168
-
169
-
170
-
171
-
172
-
173
-
174
-
175
-
176
-
177
-
178
-
179
-
180
-
181
-
182
-
183
-
184
-
185
-
 186
186 -
 187
187 -
 188
188 -
 189
189 -
 190
190 -
 191
191 -
 192
192 -
 193
193 -
 194
194 -
 195
195 -
 196
196 -
 197
197 -
 198
198 -
 199
199 -
 200
200 -
 201
201 -
 202
202 -
 203
203 -
 204
204 -
 205
205 -
 206
206 -
207
-
208
-
209
-
210
 |
 |
194
SINGAPORE AIRLINES
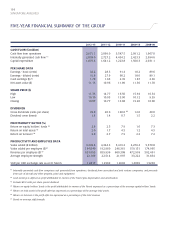
FIVE-YEAR FINANCIAL SUMMARY OF THE GROUP
2012-13 2011-12 2010-11 2009-10 2008-09
CASH FLOW ($ million)
Cash flow from operations 2,071.1 2,099.0 3,547.5 2,091.2 1,967.0
Internally generated cash flow R1 2,859.0 2,727.2 4,434.2 2,423.3 2,994.6
Capital expenditure 1,875.4 1,641.2 1,223.8 1,560.3 2,031.1
PER SHARE DATA
Earnings - basic (cents) 32.2 28.3 91.4 18.2 89.6
Earnings - diluted (cents) 31.9 27.9 90.2 18.0 89.1
Cash earnings ($) R2 1.70 1.65 2.35 1.67 2.36
Net asset value ($) 11.15 10.96 11.89 11.30 11.78
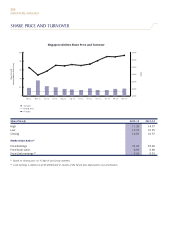
SHARE PRICE ($)
High 11.35 14.77 16.50 15.94 16.34
Low 10.10 10.05 13.00 10.12 9.39
Closing 10.87 10.77 13.68 15.20 10.00
DIVIDENDS
Gross dividends (cents per share) 23.0 20.0 140.0 R3 12.0 40.0
Dividend cover (times) 1.4 1.4 0.7 1.5 2.2
PROFITABILITY RATIOS (%)
Return on equity holders’ funds R4 2.9 2.5 7.9 1.6 7.3
Return on total assets R5 2.0 1.7 4.5 1.2 4.5
Return on turnover R6 2.9 2.7 7.9 2.2 7.2
PRODUCTIVITY AND EMPLOYEE DATA
Value added ($ million) 4,499.6 4,344.3 5,419.2 4,276.4 5,570.8
Value added per employee ($) R7 194,040 192,960 246,361 159,151 174,995
Revenue per employee ($) R7 651,093 659,936 660,308 472,918 502,491
Average employee strength 23,189 22,514 21,997 33,222 31,834
SGD per USD exchange rate as at 31 March 1.2417 1.2569 1.2602 1.4005 1.5203
R1 Internally generated cash flow comprises cash generated from operations, dividends from associated and joint venture companies, and proceeds
from sale of aircraft and other property, plant and equipment.
R2 Cash earnings is defined as profit attributable to owners of the Parent plus depreciation and amortisation.
R3 Includes 80.0 cents per share special dividend.
R4 Return on equity holders’ funds is the profit attributable to owners of the Parent expressed as a percentage of the average equity holders’ funds.
R5 Return on total assets is the profit after tax expressed as a percentage of the average total assets.
R6 Return on turnover is the profit after tax expressed as a percentage of the total revenue.
R7 Based on average staff strength.