Singapore Airlines 2013 Annual Report Download - page 166
Download and view the complete annual report
Please find page 166 of the 2013 Singapore Airlines annual report below. You can navigate through the pages in the report by either clicking on the pages listed below, or by using the keyword search tool below to find specific information within the annual report.-
 1
1 -
2
-
3
-
4
-
5
-
6
-
7
-
8
-
9
-
10
-
11
-
12
-
13
-
14
-
15
-
16
-
17
-
18
-
19
-
20
-
21
-
22
-
23
-
24
-
25
-
26
-
27
-
28
-
29
-
30
-
31
-
32
-
33
-
34
-
35
-
36
-
37
-
38
-
39
-
40
-
41
-
42
-
43
-
44
-
45
-
46
-
47
-
48
-
49
-
50
-
51
-
52
-
53
-
54
-
55
-
56
-
57
-
58
-
59
-
60
-
61
-
62
-
63
-
64
-
65
-
66
-
67
-
68
-
69
-
70
-
71
-
72
-
73
-
74
-
75
-
76
-
77
-
78
-
79
-
80
-
81
-
82
-
83
-
84
-
85
-
86
-
87
-
88
-
89
-
90
-
91
-
92
-
93
-
94
-
95
-
96
-
97
-
98
-
99
-
100
-
101
-
102
-
103
-
104
-
105
-
106
-
107
-
108
-
109
-
110
-
111
-
112
-
113
-
114
-
115
-
116
-
117
-
118
-
119
-
120
-
121
-
122
-
123
-
124
-
125
-
126
-
127
-
128
-
129
-
130
-
131
-
132
-
133
-
134
-
135
-
136
-
137
-
138
-
139
-
140
-
141
-
142
-
143
-
144
-
145
-
146
-
147
-
148
-
149
-
150
-
151
-
152
-
153
-
154
-
155
-
 156
156 -
 157
157 -
 158
158 -
 159
159 -
 160
160 -
 161
161 -
 162
162 -
 163
163 -
 164
164 -
 165
165 -
 166
166 -
 167
167 -
 168
168 -
 169
169 -
 170
170 -
 171
171 -
 172
172 -
 173
173 -
 174
174 -
 175
175 -
 176
176 -
177
-
178
-
179
-
180
-
181
-
182
-
183
-
184
-
185
-
186
-
187
-
188
-
189
-
190
-
191
-
192
-
193
-
194
-
195
-
196
-
197
-
198
-
199
-
200
-
201
-
202
-
203
-
204
-
205
-
206
-
207
-
208
-
209
-
210
 |
 |

164
SINGAPORE AIRLINES
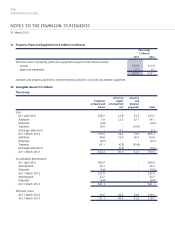
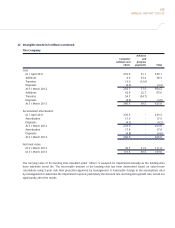
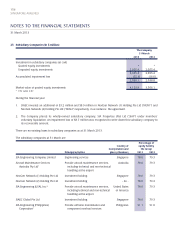
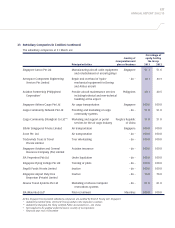
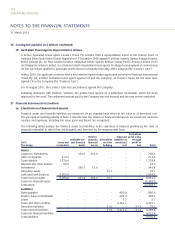
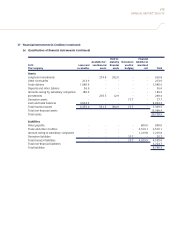
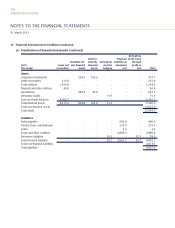
NOTES TO THE FINANCIAL STATEMENTS
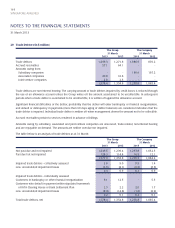
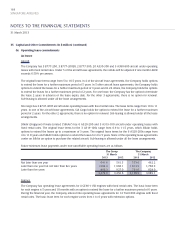
29 Trade Debtors (in $ million)
The Group The Company
31 March 31 March
2013 2012 2013 2012
Trade debtors 1,499.3 1,271.8 1,080.9 870.2
Accrued receivables 57.1 64.1 - -
Amounts owing from:
Subsidiary companies - - 189.9 195.2
Associated companies 20.0 16.6 - -
Joint venture companies 2.0 2.3 - -
1,578.4 1,354.8 1,270.8 1,065.4
Trade debtors are non-interest bearing. The carrying amount of trade debtors impaired by credit losses is reduced through
the use of an allowance account unless the Group writes off the amount ascertained to be uncollectible. In subsequent
periods when a trade debtor is ascertained to be uncollectible, it is written off against the allowance account.
Significant financial difficulties of the debtor, probability that the debtor will enter bankruptcy or financial reorganisation,
and default or delinquency in payments (more than 90 days aging of debtor balances) are considered indicators that the
trade debtor is impaired. Individual trade debtor is written off when management deems the amount not to be collectible.
Accrued receivables pertain to services rendered in advance of billings.
Amounts owing by subsidiary, associated and joint venture companies are unsecured, trade-related, non-interest bearing
and are repayable on demand. The amounts are neither overdue nor impaired.
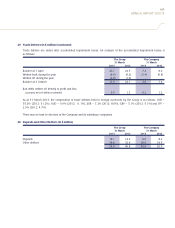
The table below is an analysis of trade debtors as at 31 March:
The Group The Company
31 March 31 March
2013 2012 2013 2012
Not past due and not impaired 1,449.6 1,239.4 1,253.8 1,052.3
Past due but not impaired 128.3 114.4 16.5 12.1
1,577.9 1,353.8 1,270.3 1,064.4
Impaired trade debtors - collectively assessed 3.8 9.0 0.5 1.4
Less: Accumulated impairment losses (3.5) (8.1) (0.2) (0.5)
0.3 0.9 0.3 0.9
Impaired trade debtors - individually assessed
Customers in bankruptcy or other financial reorganisation 6.1 12.5 - 5.3
Customers who default in payment within stipulated framework
of IATA Clearing House or Bank Settlement Plan 2.5 2.2 2.0 1.7
Less: Accumulated impairment losses (8.4) (14.6) (1.8) (6.9)
0.2 0.1 0.2 0.1
Total trade debtors, net 1,578.4 1,354.8 1,270.8 1,065.4
31 March 2013