Singapore Airlines 2013 Annual Report Download - page 68
Download and view the complete annual report
Please find page 68 of the 2013 Singapore Airlines annual report below. You can navigate through the pages in the report by either clicking on the pages listed below, or by using the keyword search tool below to find specific information within the annual report.-
 1
1 -
2
-
3
-
4
-
5
-
6
-
7
-
8
-
9
-
10
-
11
-
12
-
13
-
14
-
15
-
16
-
17
-
18
-
19
-
20
-
21
-
22
-
23
-
24
-
25
-
26
-
27
-
28
-
29
-
30
-
31
-
32
-
33
-
34
-
35
-
36
-
37
-
38
-
39
-
40
-
41
-
42
-
43
-
44
-
45
-
46
-
47
-
48
-
49
-
50
-
51
-
52
-
53
-
54
-
55
-
56
-
57
-
 58
58 -
 59
59 -
 60
60 -
 61
61 -
 62
62 -
 63
63 -
 64
64 -
 65
65 -
 66
66 -
 67
67 -
 68
68 -
 69
69 -
 70
70 -
 71
71 -
 72
72 -
 73
73 -
 74
74 -
 75
75 -
 76
76 -
 77
77 -
 78
78 -
79
-
80
-
81
-
82
-
83
-
84
-
85
-
86
-
87
-
88
-
89
-
90
-
91
-
92
-
93
-
94
-
95
-
96
-
97
-
98
-
99
-
100
-
101
-
102
-
103
-
104
-
105
-
106
-
107
-
108
-
109
-
110
-
111
-
112
-
113
-
114
-
115
-
116
-
117
-
118
-
119
-
120
-
121
-
122
-
123
-
124
-
125
-
126
-
127
-
128
-
129
-
130
-
131
-
132
-
133
-
134
-
135
-
136
-
137
-
138
-
139
-
140
-
141
-
142
-
143
-
144
-
145
-
146
-
147
-
148
-
149
-
150
-
151
-
152
-
153
-
154
-
155
-
156
-
157
-
158
-
159
-
160
-
161
-
162
-
163
-
164
-
165
-
166
-
167
-
168
-
169
-
170
-
171
-
172
-
173
-
174
-
175
-
176
-
177
-
178
-
179
-
180
-
181
-
182
-
183
-
184
-
185
-
186
-
187
-
188
-
189
-
190
-
191
-
192
-
193
-
194
-
195
-
196
-
197
-
198
-
199
-
200
-
201
-
202
-
203
-
204
-
205
-
206
-
207
-
208
-
209
-
210
 |
 |

066
SINGAPORE AIRLINES
FINANCIAL REVIEW
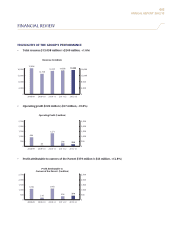
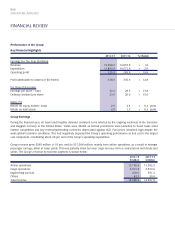
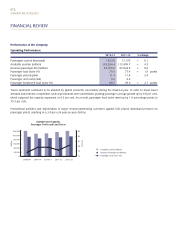
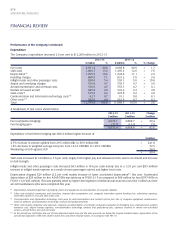
Performance of the Group
Key Financial Highlights
2012-13 2011-12 % Change
Earnings For The Year ($ million)
Revenue 15,098.2 14,857.8 + 1.6
Expenditure 14,869.0 14,571.9 + 2.0
Operating profit 229.2 285.9 - 19.8
Profit attributable to owners of the Parent 378.9 335.9 + 12.8
Per Share Data (cents)
Earnings per share – basic 32.2 28.3 + 13.8
Ordinary dividend per share 23.0 20.0 + 15.0
Ratios (%)
Return on equity holders’ funds 2.9 2.5 + 0.4 point
Return on total assets 2.0 1.7 + 0.3 point
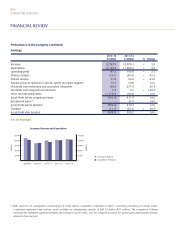
Group Earnings
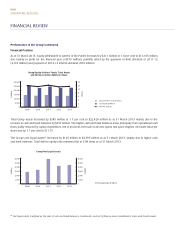
During the financial year, air travel and freighter demand continued to be affected by the ongoing weakness in the Eurozone
and sluggish recovery in the United States. Yields were diluted as tactical promotions were launched to boost loads amid
intense competition and key revenue-generating currencies depreciated against SGD. Fuel prices remained high despite the
weak global economic conditions. This had negatively impacted the Group’s operating performance as fuel cost is the largest
cost component, constituting about 40 per cent of the Group’s operating expenditure.
Group revenue grew $240 million (+1.6 per cent) to $15,098 million, mainly from airline operations, as a result of stronger
passenger carriage, albeit at lower yields. This was partially offset by lower cargo revenue from a contraction in both loads and
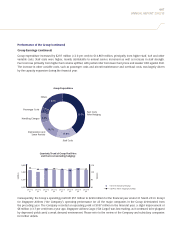
yields. The Group’s revenue by business segment is shown below:
2012-13 2011-12
$ million $ million
Airline operations 12,169.3 11,582.3
Cargo operations 2,415.3 2,673.6
Engineering services 470.9 551.5
Others 42.7 50.4
Total revenue 15,098.2 14,857.8