Singapore Airlines 2013 Annual Report Download - page 188
Download and view the complete annual report
Please find page 188 of the 2013 Singapore Airlines annual report below. You can navigate through the pages in the report by either clicking on the pages listed below, or by using the keyword search tool below to find specific information within the annual report.-
 1
1 -
2
-
3
-
4
-
5
-
6
-
7
-
8
-
9
-
10
-
11
-
12
-
13
-
14
-
15
-
16
-
17
-
18
-
19
-
20
-
21
-
22
-
23
-
24
-
25
-
26
-
27
-
28
-
29
-
30
-
31
-
32
-
33
-
34
-
35
-
36
-
37
-
38
-
39
-
40
-
41
-
42
-
43
-
44
-
45
-
46
-
47
-
48
-
49
-
50
-
51
-
52
-
53
-
54
-
55
-
56
-
57
-
58
-
59
-
60
-
61
-
62
-
63
-
64
-
65
-
66
-
67
-
68
-
69
-
70
-
71
-
72
-
73
-
74
-
75
-
76
-
77
-
78
-
79
-
80
-
81
-
82
-
83
-
84
-
85
-
86
-
87
-
88
-
89
-
90
-
91
-
92
-
93
-
94
-
95
-
96
-
97
-
98
-
99
-
100
-
101
-
102
-
103
-
104
-
105
-
106
-
107
-
108
-
109
-
110
-
111
-
112
-
113
-
114
-
115
-
116
-
117
-
118
-
119
-
120
-
121
-
122
-
123
-
124
-
125
-
126
-
127
-
128
-
129
-
130
-
131
-
132
-
133
-
134
-
135
-
136
-
137
-
138
-
139
-
140
-
141
-
142
-
143
-
144
-
145
-
146
-
147
-
148
-
149
-
150
-
151
-
152
-
153
-
154
-
155
-
156
-
157
-
158
-
159
-
160
-
161
-
162
-
163
-
164
-
165
-
166
-
167
-
168
-
169
-
170
-
171
-
172
-
173
-
174
-
175
-
176
-
177
-
 178
178 -
 179
179 -
 180
180 -
 181
181 -
 182
182 -
 183
183 -
 184
184 -
 185
185 -
 186
186 -
 187
187 -
 188
188 -
 189
189 -
 190
190 -
 191
191 -
 192
192 -
 193
193 -
 194
194 -
 195
195 -
 196
196 -
 197
197 -
 198
198 -
199
-
200
-
201
-
202
-
203
-
204
-
205
-
206
-
207
-
208
-
209
-
210
 |
 |

186
SINGAPORE AIRLINES
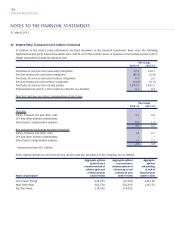
NOTES TO THE FINANCIAL STATEMENTS
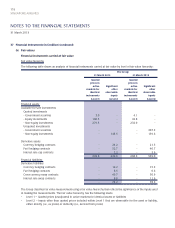
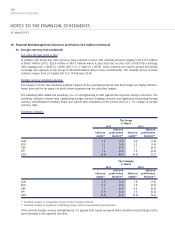
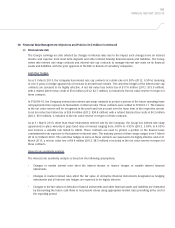
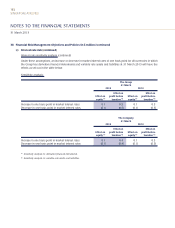
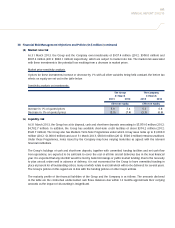
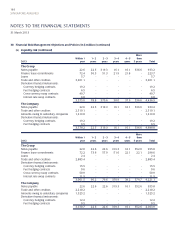
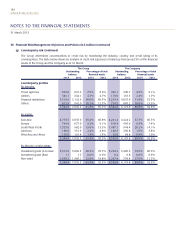
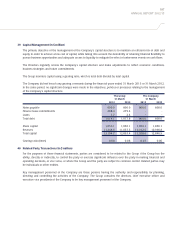
38 Financial Risk Management Objectives and Policies (in $ million) (continued)
(g) Counterparty risk (continued)
The Group determines concentrations of credit risk by monitoring the industry, country and credit rating of its
counterparties. The table below shows an analysis of credit risk exposures of balances that exceed 5% of the financial
assets of the Group and the Company as at 31 March:
The Group The Company
Outstanding Percentage of total Outstanding Percentage of total
balance financial assets balance financial assets
2013 2012 2013 2012 2013 2012 2013 2012
Counterparty profiles
By industry:
Travel agencies 632.0 637.3 7.9% 8.6% 349.1 340.7 4.8% 5.1%
Airlines 381.1 344.1 4.7% 4.7% 179.0 116.3 2.4% 1.7%
Financial institutions 5,518.9 5,132.9 68.6% 69.5% 5,279.4 4,837.6 71.8% 72.5%
Others 812.9 942.0 10.1% 12.7% 734.5 885.2 10.0% 13.3%
7,344.9 7,056.3 91.3% 95.5% 6,542.0 6,179.8 89.0% 92.6%
By region:
East Asia 4,779.5 4,935.0 59.4% 66.8% 4,241.4 4,424.2 57.7% 66.3%
Europe 744.8 677.0 9.2% 9.1% 610.4 495.6 8.3% 7.4%
South West Pacific 1,525.0 982.0 19.0% 13.3% 1,487.1 944.4 20.2% 14.1%
Americas 190.6 351.9 2.4% 4.8% 140.5 250.8 1.9% 3.8%
West Asia and Africa 105.0 110.4 1.3% 1.5% 62.6 64.8 0.9% 1.0%
7,344.9 7,056.3 91.3% 95.5% 6,542.0 6,179.8 89.0% 92.6%
By Moody’s credit ratings:
Investment grade (A to Aaa) 5,513.6 5,669.5 68.5% 76.7% 5,294.2 5,400.6 72.0% 80.9%
Investment grade (Baa) 1.1 1.7 0.0% 0.0% 0.4 0.8 0.0% 0.0%
Non-rated 1,830.2 1,385.1 22.8% 18.8% 1,247.4 778.4 17.0% 11.7%
7,344.9 7,056.3 91.3% 95.5% 6,542.0 6,179.8 89.0% 92.6%
31 March 2013