Singapore Airlines 2013 Annual Report Download - page 129
Download and view the complete annual report
Please find page 129 of the 2013 Singapore Airlines annual report below. You can navigate through the pages in the report by either clicking on the pages listed below, or by using the keyword search tool below to find specific information within the annual report.-
 1
1 -
2
-
3
-
4
-
5
-
6
-
7
-
8
-
9
-
10
-
11
-
12
-
13
-
14
-
15
-
16
-
17
-
18
-
19
-
20
-
21
-
22
-
23
-
24
-
25
-
26
-
27
-
28
-
29
-
30
-
31
-
32
-
33
-
34
-
35
-
36
-
37
-
38
-
39
-
40
-
41
-
42
-
43
-
44
-
45
-
46
-
47
-
48
-
49
-
50
-
51
-
52
-
53
-
54
-
55
-
56
-
57
-
58
-
59
-
60
-
61
-
62
-
63
-
64
-
65
-
66
-
67
-
68
-
69
-
70
-
71
-
72
-
73
-
74
-
75
-
76
-
77
-
78
-
79
-
80
-
81
-
82
-
83
-
84
-
85
-
86
-
87
-
88
-
89
-
90
-
91
-
92
-
93
-
94
-
95
-
96
-
97
-
98
-
99
-
100
-
101
-
102
-
103
-
104
-
105
-
106
-
107
-
108
-
109
-
110
-
111
-
112
-
113
-
114
-
115
-
116
-
117
-
118
-
 119
119 -
 120
120 -
 121
121 -
 122
122 -
 123
123 -
 124
124 -
 125
125 -
 126
126 -
 127
127 -
 128
128 -
 129
129 -
 130
130 -
 131
131 -
 132
132 -
 133
133 -
 134
134 -
 135
135 -
 136
136 -
 137
137 -
 138
138 -
 139
139 -
140
-
141
-
142
-
143
-
144
-
145
-
146
-
147
-
148
-
149
-
150
-
151
-
152
-
153
-
154
-
155
-
156
-
157
-
158
-
159
-
160
-
161
-
162
-
163
-
164
-
165
-
166
-
167
-
168
-
169
-
170
-
171
-
172
-
173
-
174
-
175
-
176
-
177
-
178
-
179
-
180
-
181
-
182
-
183
-
184
-
185
-
186
-
187
-
188
-
189
-
190
-
191
-
192
-
193
-
194
-
195
-
196
-
197
-
198
-
199
-
200
-
201
-
202
-
203
-
204
-
205
-
206
-
207
-
208
-
209
-
210
 |
 |

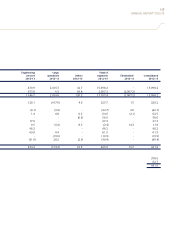
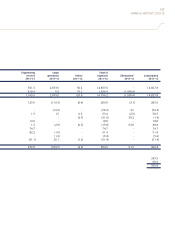
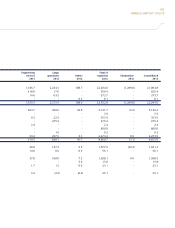
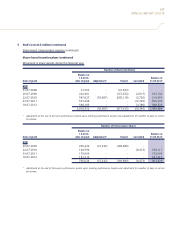
127
ANNUAL REPORT 2012/13
Engineering Cargo Total of
services operations Others segments Elimination* Consolidated
2011-12 2011-12 2011-12 2011-12 2011-12 2011-12
551.5 2,673.6 50.4 14,857.8 - 14,857.8
618.4 5.9 79.2 1,938.4 (1,938.4) -
1,169.9 2,679.5 129.6 16,796.2 (1,938.4) 14,857.8
129.6 (119.3) (0.4) 289.0 (3.1) 285.9
- (12.3) - (78.2) 3.9 (74.3)
1.5 1.5 0.3 53.4 (2.9) 50.5
- - (2.7) (31.6) 30.2 (1.4)
13.6 - - 18.0 - 18.0
1.5 (2.9) (0.2) (15.0) 63.8 48.8
74.7 - - 74.7 - 74.7
82.2 (1.5) - 51.4 - 51.4
- (1.3) - (5.4) - (5.4)
(31.1) 26.1 (1.2) (51.4) - (51.4)
272.0 (109.7) (4.2) 304.9 91.9 396.8
335.9
60.9
396.8