Singapore Airlines 2013 Annual Report Download - page 69
Download and view the complete annual report
Please find page 69 of the 2013 Singapore Airlines annual report below. You can navigate through the pages in the report by either clicking on the pages listed below, or by using the keyword search tool below to find specific information within the annual report.-
 1
1 -
2
-
3
-
4
-
5
-
6
-
7
-
8
-
9
-
10
-
11
-
12
-
13
-
14
-
15
-
16
-
17
-
18
-
19
-
20
-
21
-
22
-
23
-
24
-
25
-
26
-
27
-
28
-
29
-
30
-
31
-
32
-
33
-
34
-
35
-
36
-
37
-
38
-
39
-
40
-
41
-
42
-
43
-
44
-
45
-
46
-
47
-
48
-
49
-
50
-
51
-
52
-
53
-
54
-
55
-
56
-
57
-
58
-
 59
59 -
 60
60 -
 61
61 -
 62
62 -
 63
63 -
 64
64 -
 65
65 -
 66
66 -
 67
67 -
 68
68 -
 69
69 -
 70
70 -
 71
71 -
 72
72 -
 73
73 -
 74
74 -
 75
75 -
 76
76 -
 77
77 -
 78
78 -
 79
79 -
80
-
81
-
82
-
83
-
84
-
85
-
86
-
87
-
88
-
89
-
90
-
91
-
92
-
93
-
94
-
95
-
96
-
97
-
98
-
99
-
100
-
101
-
102
-
103
-
104
-
105
-
106
-
107
-
108
-
109
-
110
-
111
-
112
-
113
-
114
-
115
-
116
-
117
-
118
-
119
-
120
-
121
-
122
-
123
-
124
-
125
-
126
-
127
-
128
-
129
-
130
-
131
-
132
-
133
-
134
-
135
-
136
-
137
-
138
-
139
-
140
-
141
-
142
-
143
-
144
-
145
-
146
-
147
-
148
-
149
-
150
-
151
-
152
-
153
-
154
-
155
-
156
-
157
-
158
-
159
-
160
-
161
-
162
-
163
-
164
-
165
-
166
-
167
-
168
-
169
-
170
-
171
-
172
-
173
-
174
-
175
-
176
-
177
-
178
-
179
-
180
-
181
-
182
-
183
-
184
-
185
-
186
-
187
-
188
-
189
-
190
-
191
-
192
-
193
-
194
-
195
-
196
-
197
-
198
-
199
-
200
-
201
-
202
-
203
-
204
-
205
-
206
-
207
-
208
-
209
-
210
 |
 |

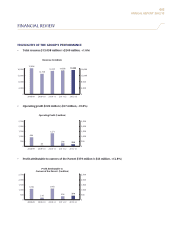
067
ANNUAL REPORT 2012/13
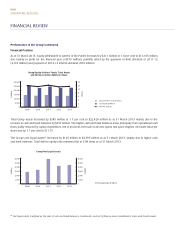
2011-12
Q1
2011-12
Q2
2011-12
Q3
2011-12
Q4
2012-13
Q1
2012-13
Q2
2012-13
Q3
2012-13
Q4
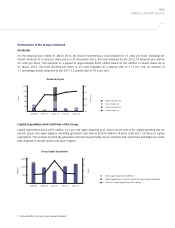
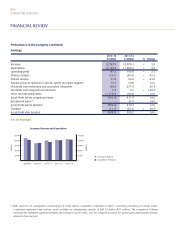
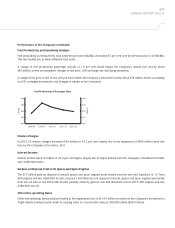
Quarterly Trend of Group Fuel Price
and Fuel Cost (excluding hedging)
1,600 150
1,400 120
1,200 90
1,000 60
$ Million
USD/BBL
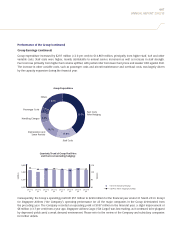
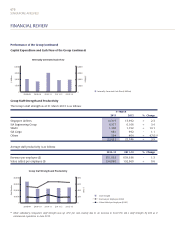
Group Expenditure
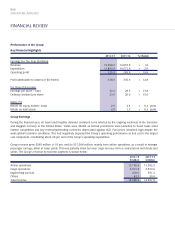
Performance of the Group (continued)
Group Earnings (continued)
Group expenditure increased by $297 million (+2.0 per cent) to $14,869 million, principally from higher staff, fuel and other
variable costs. Staff costs were higher, mainly attributable to annual service increment as well as increase in staff strength.
Fuel cost rose primarily from higher fuel volume uplifted, with partial relief from lower fuel prices and weaker USD against SGD.
The increase in other variable costs, such as passenger costs and aircraft maintenance and overhaul costs, was largely driven
by the capacity expansion during the financial year.
Consequently, the Group’s operating profit fell $57 million to $229 million for the financial year ended 31 March 2013. Except
for Singapore Airlines (“the Company”), operating performance for all the major companies in the Group deteriorated from
the preceding year. The Company recorded an operating profit of $187 million in the financial year, a slight improvement of
$6 million (+3.7 per cent) from a year ago. Singapore Airlines Cargo (“SIA Cargo”) was loss-making, as it continued to be plagued
by depressed yields amid a weak demand environment. Please refer to the review of the Company and subsidiary companies
for further details.
Fuel Costs
After Hedging
Depreciation and
Lease Rentals
Handling Charges
Staff Costs
Passenger Costs
Others
15.8%
14.5%
18.5%
4.7%
6.8%
39.7%