Singapore Airlines 2013 Annual Report Download - page 177
Download and view the complete annual report
Please find page 177 of the 2013 Singapore Airlines annual report below. You can navigate through the pages in the report by either clicking on the pages listed below, or by using the keyword search tool below to find specific information within the annual report.-
 1
1 -
2
-
3
-
4
-
5
-
6
-
7
-
8
-
9
-
10
-
11
-
12
-
13
-
14
-
15
-
16
-
17
-
18
-
19
-
20
-
21
-
22
-
23
-
24
-
25
-
26
-
27
-
28
-
29
-
30
-
31
-
32
-
33
-
34
-
35
-
36
-
37
-
38
-
39
-
40
-
41
-
42
-
43
-
44
-
45
-
46
-
47
-
48
-
49
-
50
-
51
-
52
-
53
-
54
-
55
-
56
-
57
-
58
-
59
-
60
-
61
-
62
-
63
-
64
-
65
-
66
-
67
-
68
-
69
-
70
-
71
-
72
-
73
-
74
-
75
-
76
-
77
-
78
-
79
-
80
-
81
-
82
-
83
-
84
-
85
-
86
-
87
-
88
-
89
-
90
-
91
-
92
-
93
-
94
-
95
-
96
-
97
-
98
-
99
-
100
-
101
-
102
-
103
-
104
-
105
-
106
-
107
-
108
-
109
-
110
-
111
-
112
-
113
-
114
-
115
-
116
-
117
-
118
-
119
-
120
-
121
-
122
-
123
-
124
-
125
-
126
-
127
-
128
-
129
-
130
-
131
-
132
-
133
-
134
-
135
-
136
-
137
-
138
-
139
-
140
-
141
-
142
-
143
-
144
-
145
-
146
-
147
-
148
-
149
-
150
-
151
-
152
-
153
-
154
-
155
-
156
-
157
-
158
-
159
-
160
-
161
-
162
-
163
-
164
-
165
-
166
-
 167
167 -
 168
168 -
 169
169 -
 170
170 -
 171
171 -
 172
172 -
 173
173 -
 174
174 -
 175
175 -
 176
176 -
 177
177 -
 178
178 -
 179
179 -
 180
180 -
 181
181 -
 182
182 -
 183
183 -
 184
184 -
 185
185 -
 186
186 -
 187
187 -
188
-
189
-
190
-
191
-
192
-
193
-
194
-
195
-
196
-
197
-
198
-
199
-
200
-
201
-
202
-
203
-
204
-
205
-
206
-
207
-
208
-
209
-
210
 |
 |
175
ANNUAL REPORT 2012/13
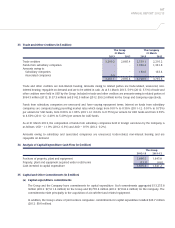
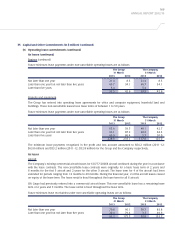
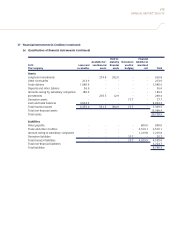
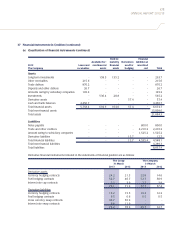
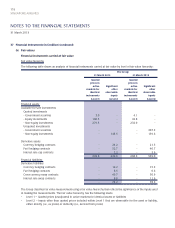
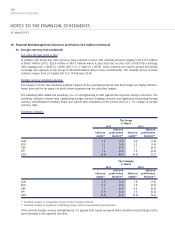
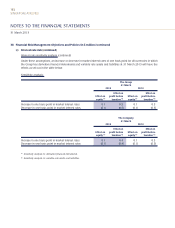
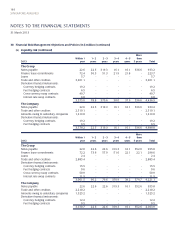
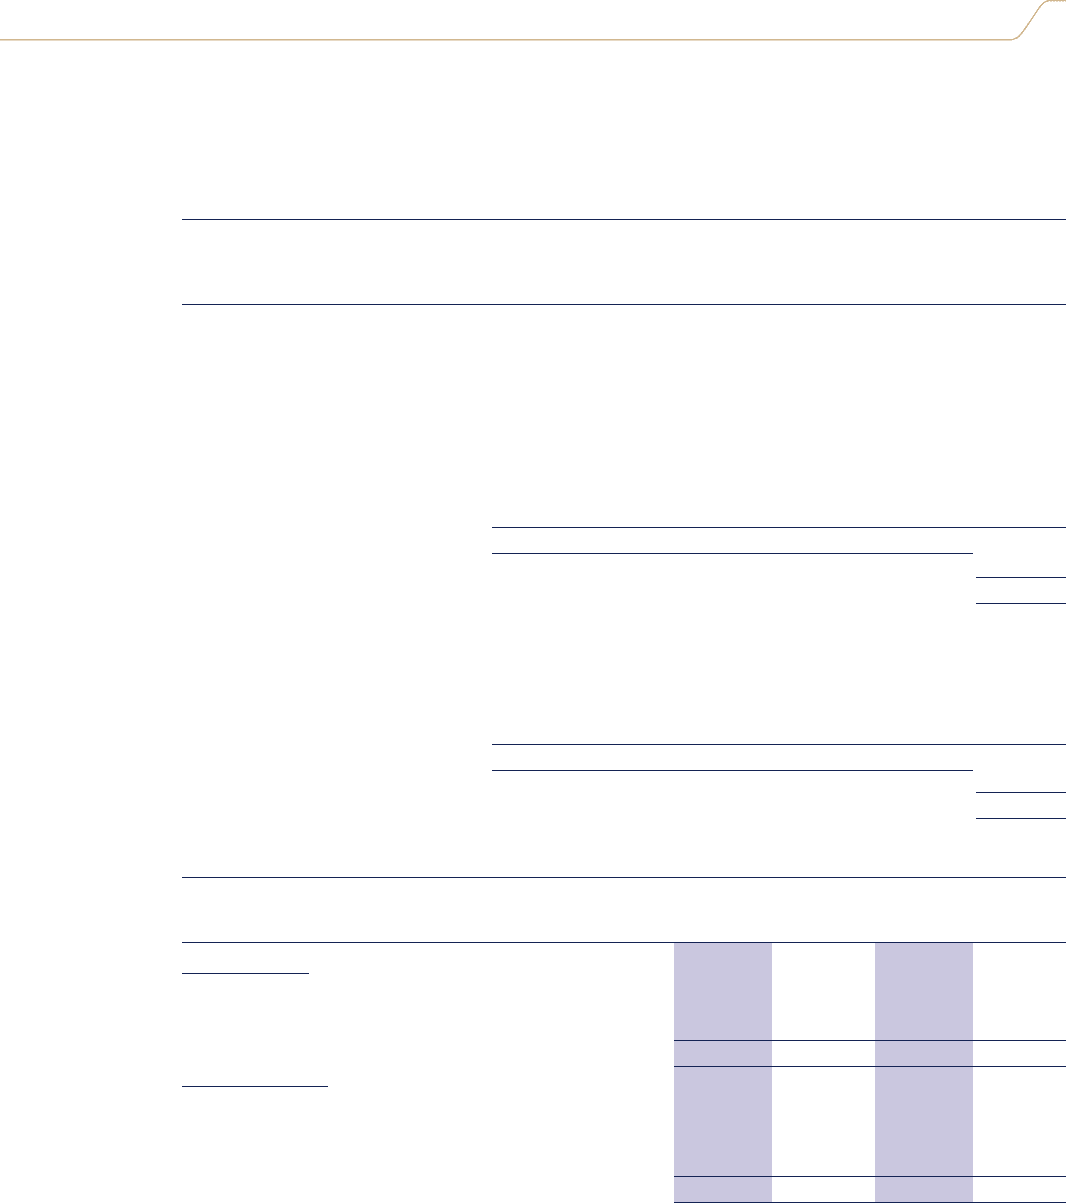
37 Financial Instruments (in $ million) (continued)
(a) Classification of financial instruments (continued)
Held-to- Financial
Available-for- maturity Derivatives liabilities at
2012 Loans and sale financial financial used for amortised
The Company receivables assets assets hedging cost Total
Assets
Long-term investments - 158.5 135.2 - - 293.7
Other receivables 215.6 - - - - 215.6
Trade debtors 870.2 - - - - 870.2
Deposits and other debtors 26.7 - - - - 26.7
Amounts owing by subsidiary companies 195.2 - - - - 195.2
Investments - 536.4 28.8 - - 565.2
Derivative assets - - - 57.4 - 57.4
Cash and bank balances 4,450.7 - - - - 4,450.7
Total financial assets 5,758.4 694.9 164.0 57.4 - 6,674.7
Total non-financial assets 15,009.6
Total assets 21,684.3
Liabilities
Notes payable - - - - 800.0 800.0
Trade and other creditors - - - - 2,210.2 2,210.2
Amount owing to subsidiary companies - - - - 1,525.2 1,525.2
Derivative liabilities - - - 12.7 - 12.7
Total financial liabilities - - - 12.7 4,535.4 4,548.1
Total non-financial liabilities 4,289.3
Total liabilities 8,837.4
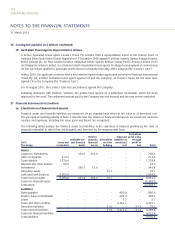
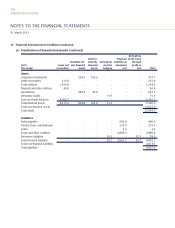
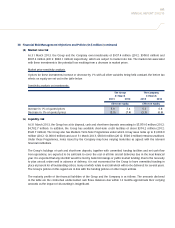
Derivative financial instruments included in the statements of financial position are as follows:
The Group The Company
31 March 31 March
2013 2012 2013 2012
Derivative assets
Currency hedging contracts 24.2 21.3 22.8 14.6
Fuel hedging contracts 52.7 46.7 52.7 38.9
Interest rate cap contracts 2.2 3.9 2.2 3.9
79.1 71.9 77.7 57.4
Derivative liabilities
Currency hedging contracts 19.2 15.5 19.2 12.2
Fuel hedging contracts 6.5 0.6 6.5 0.5
Cross currency swap contracts 40.7 50.9 - -
Interest rate swap contracts 6.8 11.9 - -
73.2 78.9 25.7 12.7