Singapore Airlines 2013 Annual Report Download - page 178
Download and view the complete annual report
Please find page 178 of the 2013 Singapore Airlines annual report below. You can navigate through the pages in the report by either clicking on the pages listed below, or by using the keyword search tool below to find specific information within the annual report.-
 1
1 -
2
-
3
-
4
-
5
-
6
-
7
-
8
-
9
-
10
-
11
-
12
-
13
-
14
-
15
-
16
-
17
-
18
-
19
-
20
-
21
-
22
-
23
-
24
-
25
-
26
-
27
-
28
-
29
-
30
-
31
-
32
-
33
-
34
-
35
-
36
-
37
-
38
-
39
-
40
-
41
-
42
-
43
-
44
-
45
-
46
-
47
-
48
-
49
-
50
-
51
-
52
-
53
-
54
-
55
-
56
-
57
-
58
-
59
-
60
-
61
-
62
-
63
-
64
-
65
-
66
-
67
-
68
-
69
-
70
-
71
-
72
-
73
-
74
-
75
-
76
-
77
-
78
-
79
-
80
-
81
-
82
-
83
-
84
-
85
-
86
-
87
-
88
-
89
-
90
-
91
-
92
-
93
-
94
-
95
-
96
-
97
-
98
-
99
-
100
-
101
-
102
-
103
-
104
-
105
-
106
-
107
-
108
-
109
-
110
-
111
-
112
-
113
-
114
-
115
-
116
-
117
-
118
-
119
-
120
-
121
-
122
-
123
-
124
-
125
-
126
-
127
-
128
-
129
-
130
-
131
-
132
-
133
-
134
-
135
-
136
-
137
-
138
-
139
-
140
-
141
-
142
-
143
-
144
-
145
-
146
-
147
-
148
-
149
-
150
-
151
-
152
-
153
-
154
-
155
-
156
-
157
-
158
-
159
-
160
-
161
-
162
-
163
-
164
-
165
-
166
-
167
-
 168
168 -
 169
169 -
 170
170 -
 171
171 -
 172
172 -
 173
173 -
 174
174 -
 175
175 -
 176
176 -
 177
177 -
 178
178 -
 179
179 -
 180
180 -
 181
181 -
 182
182 -
 183
183 -
 184
184 -
 185
185 -
 186
186 -
 187
187 -
 188
188 -
189
-
190
-
191
-
192
-
193
-
194
-
195
-
196
-
197
-
198
-
199
-
200
-
201
-
202
-
203
-
204
-
205
-
206
-
207
-
208
-
209
-
210
 |
 |
176
SINGAPORE AIRLINES
NOTES TO THE FINANCIAL STATEMENTS
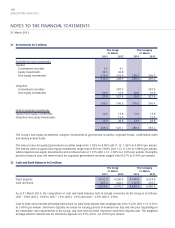
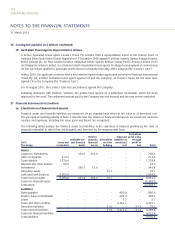
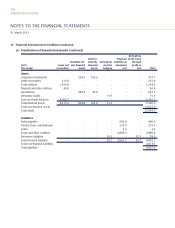
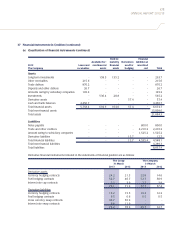
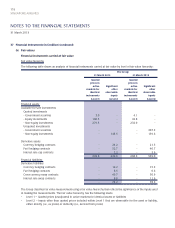
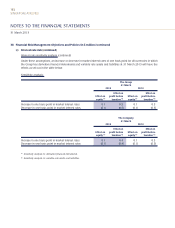
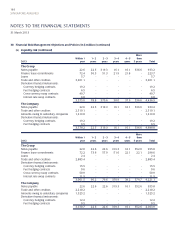
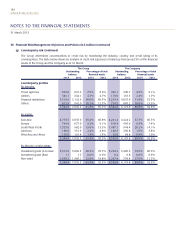
37 Financial Instruments (in $ million) (continued)
(b) Fair values
Financial instruments carried at fair value
Fair value hierarchy
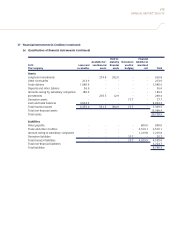
The following table shows an analysis of financial instruments carried at fair value by level of fair value hierarchy:
The Group
31 March 2013 31 March 2012
Quoted Quoted
prices in prices in
active Significant active Significant
markets for other markets for other
identical observable identical observable
instruments inputs instruments inputs
(Level 1) (Level 2) (Level 1) (Level 2)
Financial assets:
Available-for-sale investments
Quoted investments
- Government securities 3.0 - 4.1 -
- Equity investments 166.5 - 32.8 -
- Non-equity investments 279.5 - 232.0 -
Unquoted investments
- Government securities - - - 307.5
- Non-equity investments - 143.5 - 159.6
Derivative assets
Currency hedging contracts - 24.2 - 21.3
Fuel hedging contracts - 52.7 - 46.7
Interest rate cap contracts - 2.2 - 3.9
449.0 222.6 268.9 539.0
Financial liabilities:
Derivative liabilities
Currency hedging contracts - 19.2 - 15.5
Fuel hedging contracts - 6.5 - 0.6
Cross currency swap contracts - 40.7 - 50.9
Interest rate swap contracts - 6.8 - 11.9
- 73.2 - 78.9
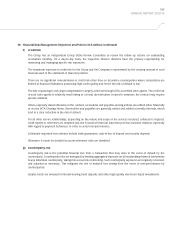
The Group classifies fair value measurement using a fair value hierarchy that reflects the significance of the inputs used
in making the measurements. The fair value hierarchy has the following levels:
• Level 1 – Quoted prices (unadjusted) in active markets for identical assets or liabilities
• Level 2 – Inputs other than quoted prices included within Level 1 that are observable for the asset or liability,
either directly (i.e., as prices) or indirectly (i.e., derived from prices)
31 March 2013