Singapore Airlines 2013 Annual Report Download - page 124
Download and view the complete annual report
Please find page 124 of the 2013 Singapore Airlines annual report below. You can navigate through the pages in the report by either clicking on the pages listed below, or by using the keyword search tool below to find specific information within the annual report.-
 1
1 -
2
-
3
-
4
-
5
-
6
-
7
-
8
-
9
-
10
-
11
-
12
-
13
-
14
-
15
-
16
-
17
-
18
-
19
-
20
-
21
-
22
-
23
-
24
-
25
-
26
-
27
-
28
-
29
-
30
-
31
-
32
-
33
-
34
-
35
-
36
-
37
-
38
-
39
-
40
-
41
-
42
-
43
-
44
-
45
-
46
-
47
-
48
-
49
-
50
-
51
-
52
-
53
-
54
-
55
-
56
-
57
-
58
-
59
-
60
-
61
-
62
-
63
-
64
-
65
-
66
-
67
-
68
-
69
-
70
-
71
-
72
-
73
-
74
-
75
-
76
-
77
-
78
-
79
-
80
-
81
-
82
-
83
-
84
-
85
-
86
-
87
-
88
-
89
-
90
-
91
-
92
-
93
-
94
-
95
-
96
-
97
-
98
-
99
-
100
-
101
-
102
-
103
-
104
-
105
-
106
-
107
-
108
-
109
-
110
-
111
-
112
-
113
-
 114
114 -
 115
115 -
 116
116 -
 117
117 -
 118
118 -
 119
119 -
 120
120 -
 121
121 -
 122
122 -
 123
123 -
 124
124 -
 125
125 -
 126
126 -
 127
127 -
 128
128 -
 129
129 -
 130
130 -
 131
131 -
 132
132 -
 133
133 -
 134
134 -
135
-
136
-
137
-
138
-
139
-
140
-
141
-
142
-
143
-
144
-
145
-
146
-
147
-
148
-
149
-
150
-
151
-
152
-
153
-
154
-
155
-
156
-
157
-
158
-
159
-
160
-
161
-
162
-
163
-
164
-
165
-
166
-
167
-
168
-
169
-
170
-
171
-
172
-
173
-
174
-
175
-
176
-
177
-
178
-
179
-
180
-
181
-
182
-
183
-
184
-
185
-
186
-
187
-
188
-
189
-
190
-
191
-
192
-
193
-
194
-
195
-
196
-
197
-
198
-
199
-
200
-
201
-
202
-
203
-
204
-
205
-
206
-
207
-
208
-
209
-
210
 |
 |

122
SINGAPORE AIRLINES
NOTES TO THE FINANCIAL STATEMENTS
3 Significant Accounting Estimates
Estimates and assumptions concerning the future are made in the preparation of the financial statements. They affect the
application of the Group’s accounting policies, reported amounts of assets, liabilities, income and expenses, and disclosures
made. They are assessed on an ongoing basis and are based on experience and relevant factors, including expectations of
future events that are believed to be reasonable under the circumstances.
The key assumptions concerning the future and other key sources of estimation uncertainty at the end of the reporting
period that have a significant risk of causing a material adjustment to the carrying amounts of assets and liabilities within
the next financial year are discussed below.
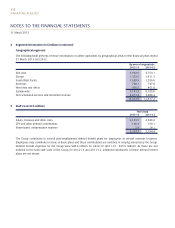
(a) Impairment of property, plant and equipment – aircraft fleet
Impairment is recognised when events and circumstances indicate that the aircraft may be impaired and the carrying
amounts of the aircraft exceed the recoverable amounts. Recoverable amount is defined as the higher of an aircraft’s
fair value less costs to sell and its value-in-use. The fair value less costs to sell computation is based on available
data from binding sales transactions in an arm’s length transaction of similar assets or observable market prices less
incremental costs for disposing the asset. In determining the recoverable amounts of the aircraft, certain estimates
regarding the current fair market value of the aircraft are made. The current fair market value is determined based
on desktop valuations from an independent appraisal for fleet with similar operational lives. When value-in-use
calculations are undertaken, the Group uses discounted cash flow projections based on financial budgets approved by
the management covering a specified period.
(b) Depreciation of property, plant and equipment – aircraft fleet
Aircraft are depreciated on a straight-line basis at rates which are calculated to write down their cost to their estimated
residual values at the end of their operational lives. Certain estimates regarding the operational lives and residual values
of the fleet are made by the Group based on past experience and these are in line with the industry. The operational
lives and residual values are reviewed on an annual basis. The carrying amount of the Group’s and the Company’s
aircraft fleet at 31 March 2013 was $10,546.1 million (2012: $11,024.2 million) and $8,553.9 million (2012:
$8,985.5 million) respectively.
During the year, the Group reduced the estimated useful lives and residual values for certain aircraft pursuant to the
sale of these aircraft. Consequently, an additional depreciation expense of $30.0 million (2011-12: $69.3 million) was
charged to the profit and loss account.
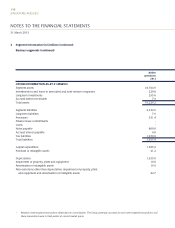
(c) Passenger revenue recognition
Passenger sales are recognised as operating revenue when the transportation is provided. The value of unused tickets
is included as sales in advance of carriage on the statement of financial position and recognised as revenue at the end
of two years. This is estimated based on historical trends and experiences of the Group whereby ticket uplift occurs
mainly within the first two years. The carrying amount of the Group’s and the Company’s sales in advance of carriage
at 31 March 2013 was $1,434.3 million (2012: $1,456.8 million) and $1,367.7 million (2012: $1,409.5 million)
respectively.
(d) Frequent Flyer programme
The Company operates a frequent flyer programme called “KrisFlyer” that provides travel awards to programme
members based on accumulated mileage. A portion of passenger revenue attributable to the award of frequent flyer
benefits is deferred until they are utilised. The deferment of the revenue is estimated based on historical trends of
breakage and redemption, which is then used to project the expected utilisation of these benefits. Any remaining
unutilised benefits are recognised as revenue upon expiry. The carrying amount of the Group’s and the Company’s
deferred revenue at 31 March 2013 was $532.5 million (2012: $497.0 million).
31 March 2013