Singapore Airlines 2013 Annual Report Download - page 72
Download and view the complete annual report
Please find page 72 of the 2013 Singapore Airlines annual report below. You can navigate through the pages in the report by either clicking on the pages listed below, or by using the keyword search tool below to find specific information within the annual report.-
 1
1 -
2
-
3
-
4
-
5
-
6
-
7
-
8
-
9
-
10
-
11
-
12
-
13
-
14
-
15
-
16
-
17
-
18
-
19
-
20
-
21
-
22
-
23
-
24
-
25
-
26
-
27
-
28
-
29
-
30
-
31
-
32
-
33
-
34
-
35
-
36
-
37
-
38
-
39
-
40
-
41
-
42
-
43
-
44
-
45
-
46
-
47
-
48
-
49
-
50
-
51
-
52
-
53
-
54
-
55
-
56
-
57
-
58
-
59
-
60
-
61
-
 62
62 -
 63
63 -
 64
64 -
 65
65 -
 66
66 -
 67
67 -
 68
68 -
 69
69 -
 70
70 -
 71
71 -
 72
72 -
 73
73 -
 74
74 -
 75
75 -
 76
76 -
 77
77 -
 78
78 -
 79
79 -
 80
80 -
 81
81 -
 82
82 -
83
-
84
-
85
-
86
-
87
-
88
-
89
-
90
-
91
-
92
-
93
-
94
-
95
-
96
-
97
-
98
-
99
-
100
-
101
-
102
-
103
-
104
-
105
-
106
-
107
-
108
-
109
-
110
-
111
-
112
-
113
-
114
-
115
-
116
-
117
-
118
-
119
-
120
-
121
-
122
-
123
-
124
-
125
-
126
-
127
-
128
-
129
-
130
-
131
-
132
-
133
-
134
-
135
-
136
-
137
-
138
-
139
-
140
-
141
-
142
-
143
-
144
-
145
-
146
-
147
-
148
-
149
-
150
-
151
-
152
-
153
-
154
-
155
-
156
-
157
-
158
-
159
-
160
-
161
-
162
-
163
-
164
-
165
-
166
-
167
-
168
-
169
-
170
-
171
-
172
-
173
-
174
-
175
-
176
-
177
-
178
-
179
-
180
-
181
-
182
-
183
-
184
-
185
-
186
-
187
-
188
-
189
-
190
-
191
-
192
-
193
-
194
-
195
-
196
-
197
-
198
-
199
-
200
-
201
-
202
-
203
-
204
-
205
-
206
-
207
-
208
-
209
-
210
 |
 |
070
SINGAPORE AIRLINES
FINANCIAL REVIEW
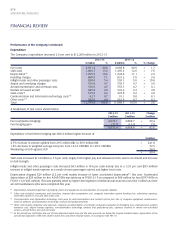
Performance of the Group (continued)
Capital Expenditure and Cash Flow of the Group (continued)
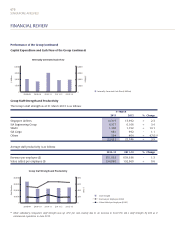
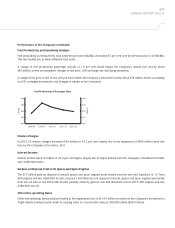
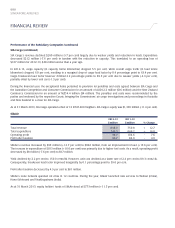
Internally Generated Cash Flow
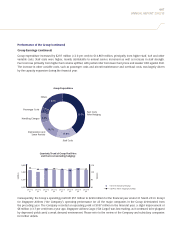
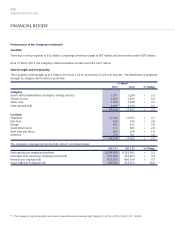
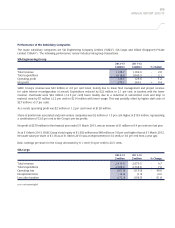
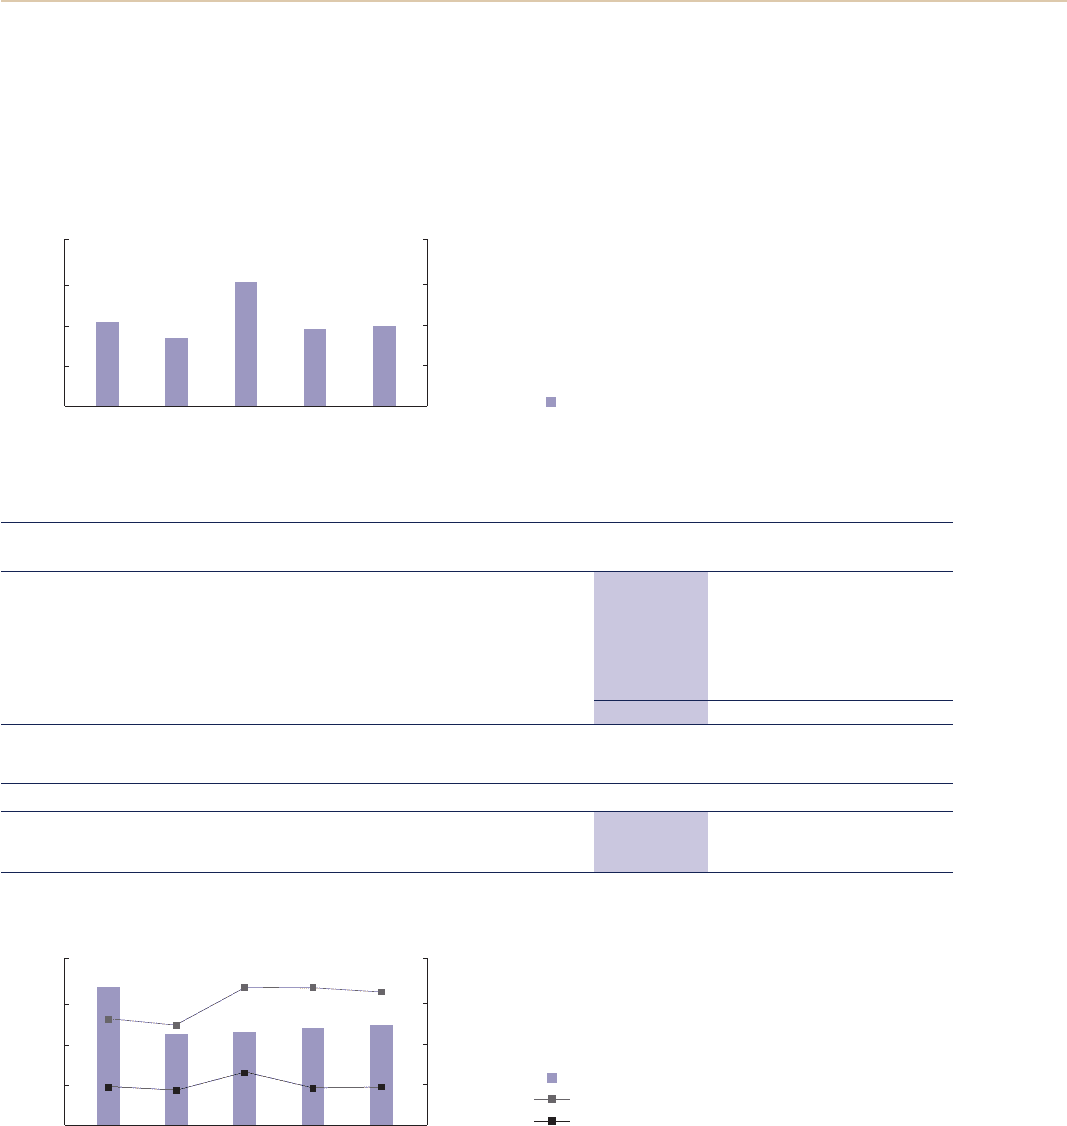
Group Staff Strength and Productivity
$ MillionStaff Number
6,000
40,000
4,500
30,000
3,000
20,000
1,500
10,000
0
0
$ Million $ ‘000
1,500
200
3,000
400
4,500
600
6,000
800
0
0
2008-09 2009-10 2010-11 2011-12 2012-13
Internally Generated Cash Flow ($ Million)
R3 Other subsidiary companies’ staff strength was up 47.0 per cent, mainly due to an increase in Scoot Pte. Ltd.’s staff strength by 204 as it
commenced operations in June 2012.
Value Added per Employee ($’000)
Revenue per Employee ($’000)
Staff Strength
Group Staff Strength and Productivity
The Group’s staff strength as at 31 March 2013 is as follows:
31 March
2013 2012 % Change
Singapore Airlines 14,319 13,992 + 2.3
SIA Engineering Group 6,377 6,166 + 3.4
SilkAir 1,360 1,192 + 14.1
SIA Cargo 981 992 - 1.1
Others 594 404 + 47.0 R3
23,631 22,746 + 3.9
Average staff productivity is as follows:
2012-13 2011-12 % Change
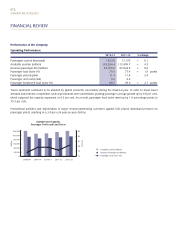
Revenue per employee ($) 651,093 659,936 - 1.3
Value added per employee ($) 194,040 192,960 + 0.6
2008-09 2009-10 2010-11 2011-12 2012-13