Singapore Airlines 2013 Annual Report Download - page 179
Download and view the complete annual report
Please find page 179 of the 2013 Singapore Airlines annual report below. You can navigate through the pages in the report by either clicking on the pages listed below, or by using the keyword search tool below to find specific information within the annual report.-
 1
1 -
2
-
3
-
4
-
5
-
6
-
7
-
8
-
9
-
10
-
11
-
12
-
13
-
14
-
15
-
16
-
17
-
18
-
19
-
20
-
21
-
22
-
23
-
24
-
25
-
26
-
27
-
28
-
29
-
30
-
31
-
32
-
33
-
34
-
35
-
36
-
37
-
38
-
39
-
40
-
41
-
42
-
43
-
44
-
45
-
46
-
47
-
48
-
49
-
50
-
51
-
52
-
53
-
54
-
55
-
56
-
57
-
58
-
59
-
60
-
61
-
62
-
63
-
64
-
65
-
66
-
67
-
68
-
69
-
70
-
71
-
72
-
73
-
74
-
75
-
76
-
77
-
78
-
79
-
80
-
81
-
82
-
83
-
84
-
85
-
86
-
87
-
88
-
89
-
90
-
91
-
92
-
93
-
94
-
95
-
96
-
97
-
98
-
99
-
100
-
101
-
102
-
103
-
104
-
105
-
106
-
107
-
108
-
109
-
110
-
111
-
112
-
113
-
114
-
115
-
116
-
117
-
118
-
119
-
120
-
121
-
122
-
123
-
124
-
125
-
126
-
127
-
128
-
129
-
130
-
131
-
132
-
133
-
134
-
135
-
136
-
137
-
138
-
139
-
140
-
141
-
142
-
143
-
144
-
145
-
146
-
147
-
148
-
149
-
150
-
151
-
152
-
153
-
154
-
155
-
156
-
157
-
158
-
159
-
160
-
161
-
162
-
163
-
164
-
165
-
166
-
167
-
168
-
 169
169 -
 170
170 -
 171
171 -
 172
172 -
 173
173 -
 174
174 -
 175
175 -
 176
176 -
 177
177 -
 178
178 -
 179
179 -
 180
180 -
 181
181 -
 182
182 -
 183
183 -
 184
184 -
 185
185 -
 186
186 -
 187
187 -
 188
188 -
 189
189 -
190
-
191
-
192
-
193
-
194
-
195
-
196
-
197
-
198
-
199
-
200
-
201
-
202
-
203
-
204
-
205
-
206
-
207
-
208
-
209
-
210
 |
 |

177
ANNUAL REPORT 2012/13
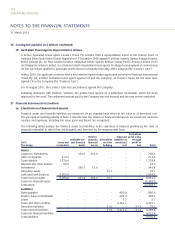
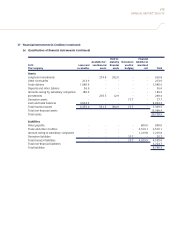
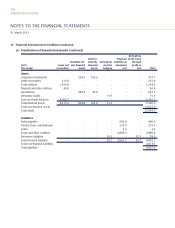
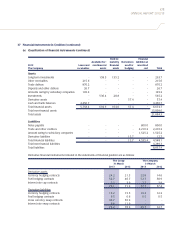
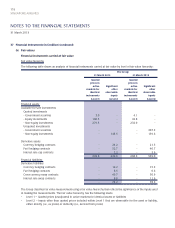
37 Financial Instruments (in $ million) (continued)
(b) Fair values (continued)
Financial instruments carried at fair value (continued)
Determination of fair value
The Group and the Company have carried all investment securities that are classified as available-for-sale financial
assets and all derivative instruments at their fair values.
The fair values of jet fuel swap contracts are the mark-to-market values of these contracts. The fair values of jet fuel
option contracts are determined by reference to available market information and the Black-Scholes option valuation
model. As the Group hedges its jet fuel requirements in Mean of Platts Singapore Jet Kerosene (“MOPS”) and that the
majority of the Group’s fuel uplifts are in MOPS, the MOPS price (2013: USD 122.17/BBL, 2012: USD 135.42/BBL)
is used as the input for market fuel price to the Black-Scholes option valuation model. Consequently, the annualised
volatility (2012-13: 11.75%, 2011-12: 11.34%) of the jet fuel swap and option contracts is also estimated with daily
MOPS price. The continuously compounded risk-free rate estimated as average of the past 12 months’ Singapore
Government Securities benchmark issues’ one-year yield (2012-13: 0.27%, 2011-12: 0.33%) was also applied to
each individual jet fuel option contract to derive their estimated fair values as at the end of the reporting period.
The fair value of forward currency contracts is determined by reference to current forward prices for contracts with
similar maturity profiles. The fair values of foreign currency option contracts, interest rate swap contracts and interest
rate cap contracts are determined by reference to valuation reports provided by counterparties.
The fair value of cross currency swap contracts is determined based on quoted market prices or dealer quotes for
similar instruments used.
The fair value of quoted investments is generally determined by reference to stock exchange quoted market bid prices
at the close of the business at the end of the reporting period. For investments where there is no active market, fair
value is determined using valuation techniques. Such techniques include using recent arm’s length market transactions
or reference to the current market value of another instrument (which is substantially the same).
Financial instruments whose carrying amounts approximate fair value
The carrying amounts of the following financial assets and liabilities approximate their fair values due to their short-
term nature: cash and bank balances, funds from subsidiary companies, amounts owing to/by subsidiary companies,
trade debtors, other debtors, trade and other creditors.
Financial instruments carried at other than fair value
Long-term investments classified as available-for-sale amounting to $98.9 million (2012: $98.8 million) for the Group
and $18.8 million (2012: $18.8 million) for the Company are stated at cost because the fair values cannot be obtained
directly from quoted market price or indirectly using valuation techniques supported by observable market data.