Singapore Airlines 2013 Annual Report Download - page 137
Download and view the complete annual report
Please find page 137 of the 2013 Singapore Airlines annual report below. You can navigate through the pages in the report by either clicking on the pages listed below, or by using the keyword search tool below to find specific information within the annual report.-
 1
1 -
2
-
3
-
4
-
5
-
6
-
7
-
8
-
9
-
10
-
11
-
12
-
13
-
14
-
15
-
16
-
17
-
18
-
19
-
20
-
21
-
22
-
23
-
24
-
25
-
26
-
27
-
28
-
29
-
30
-
31
-
32
-
33
-
34
-
35
-
36
-
37
-
38
-
39
-
40
-
41
-
42
-
43
-
44
-
45
-
46
-
47
-
48
-
49
-
50
-
51
-
52
-
53
-
54
-
55
-
56
-
57
-
58
-
59
-
60
-
61
-
62
-
63
-
64
-
65
-
66
-
67
-
68
-
69
-
70
-
71
-
72
-
73
-
74
-
75
-
76
-
77
-
78
-
79
-
80
-
81
-
82
-
83
-
84
-
85
-
86
-
87
-
88
-
89
-
90
-
91
-
92
-
93
-
94
-
95
-
96
-
97
-
98
-
99
-
100
-
101
-
102
-
103
-
104
-
105
-
106
-
107
-
108
-
109
-
110
-
111
-
112
-
113
-
114
-
115
-
116
-
117
-
118
-
119
-
120
-
121
-
122
-
123
-
124
-
125
-
126
-
 127
127 -
 128
128 -
 129
129 -
 130
130 -
 131
131 -
 132
132 -
 133
133 -
 134
134 -
 135
135 -
 136
136 -
 137
137 -
 138
138 -
 139
139 -
 140
140 -
 141
141 -
 142
142 -
 143
143 -
 144
144 -
 145
145 -
 146
146 -
 147
147 -
148
-
149
-
150
-
151
-
152
-
153
-
154
-
155
-
156
-
157
-
158
-
159
-
160
-
161
-
162
-
163
-
164
-
165
-
166
-
167
-
168
-
169
-
170
-
171
-
172
-
173
-
174
-
175
-
176
-
177
-
178
-
179
-
180
-
181
-
182
-
183
-
184
-
185
-
186
-
187
-
188
-
189
-
190
-
191
-
192
-
193
-
194
-
195
-
196
-
197
-
198
-
199
-
200
-
201
-
202
-
203
-
204
-
205
-
206
-
207
-
208
-
209
-
210
 |
 |

135
ANNUAL REPORT 2012/13
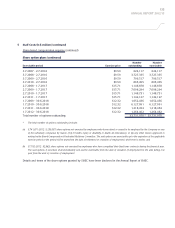
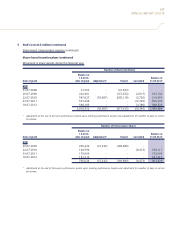
5 Staff Costs (in $ million) (continued)
Share-based compensation expense (continued)
Share option plans (continued)
Number Number
Exercisable period Exercise price outstanding exercisable
3.7.2007 - 2.7.2016 $9.59 624,117 624,117
3.7.2008 - 2.7.2016 $9.59 3,727,335 3,727,335
3.7.2009 - 2.7.2016 $9.59 796,517 796,517
3.7.2010 - 2.7.2016 $9.59 865,495 865,495
2.7.2008 - 1.7.2017 $15.71 1,146,878 1,146,878
2.7.2009 - 1.7.2017 $15.71 7,098,294 7,098,294
2.7.2010 - 1.7.2017 $15.71 1,148,731 1,148,731
2.7.2011 - 1.7.2017 $15.71 1,142,127 1,142,127
1.7.2009 - 30.6.2018 $12.32 1,052,436 1,052,436
1.7.2010 - 30.6.2018 $12.32 6,127,091 6,127,091
1.7.2011 - 30.6.2018 $12.32 1,218,454 1,218,454
1.7.2012 - 30.6.2018 $12.32 1,264,462 1,264,462
Total number of options outstanding 33,731,970 @ 33,731,970
@ The total number of options outstanding includes:
(a) 5,741,871 (2012: 5,255,057) share options not exercised by employees who have retired or ceased to be employed by the Company or any
of the subsidiary companies by reason of (i) ill health, injury or disability or death; (ii) redundancy; or (iii) any other reason approved in
writing by the Board Compensation & Industrial Relations Committee. The said options are exercisable up to the expiration of the applicable
exercise period or the period of five years from the date of retirement or cessation of employment, whichever is earlier; and
(b) 37,792 (2012: 92,982) share options not exercised by employees who have completed their fixed term contracts during the financial year.
The said options, if unvested, shall immediately vest and be exercisable from the date of cessation of employment to the date falling one
year from the date of cessation of employment.
Details and terms of the share options granted by SIAEC have been disclosed in the Annual Report of SIAEC.