Salesforce.com 2016 Annual Report Download - page 74
Download and view the complete annual report
Please find page 74 of the 2016 Salesforce.com annual report below. You can navigate through the pages in the report by either clicking on the pages listed below, or by using the keyword search tool below to find specific information within the annual report.-
 1
1 -
2
-
3
-
4
-
5
-
6
-
7
-
8
-
9
-
10
-
11
-
12
-
13
-
14
-
15
-
16
-
17
-
18
-
19
-
20
-
21
-
22
-
23
-
24
-
25
-
26
-
27
-
28
-
29
-
30
-
31
-
32
-
33
-
34
-
35
-
36
-
37
-
38
-
39
-
40
-
41
-
42
-
43
-
44
-
45
-
46
-
47
-
48
-
49
-
50
-
51
-
52
-
53
-
54
-
55
-
56
-
57
-
58
-
59
-
60
-
61
-
62
-
63
-
 64
64 -
 65
65 -
 66
66 -
 67
67 -
 68
68 -
 69
69 -
 70
70 -
 71
71 -
 72
72 -
 73
73 -
 74
74 -
 75
75 -
 76
76 -
 77
77 -
 78
78 -
 79
79 -
 80
80 -
 81
81 -
 82
82 -
 83
83 -
 84
84 -
85
-
86
-
87
-
88
-
89
-
90
-
91
-
92
-
93
-
94
-
95
-
96
-
97
-
98
-
99
-
100
-
101
-
102
-
103
-
104
-
105
-
106
-
107
-
108
-
109
-
110
-
111
-
112
-
113
-
114
-
115
-
116
-
117
-
118
-
119
-
120
-
121
-
122
-
123
-
124
-
125
-
126
-
127
-
128
-
129
-
130
-
131
-
132
-
133
-
134
-
135
-
136
-
137
-
138
 |
 |

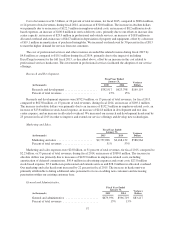
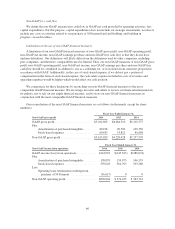
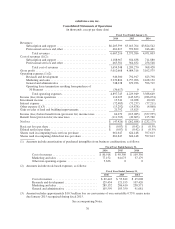
Fiscal Year Ended January 31,
Non-GAAP net income 2016 2015 2014
GAAP net loss ............................. $ (47,426) $(262,688) $(232,175)
Plus:
Amortization of purchased intangibles ...... 158,070 154,973 146,535
Amortization of acquired lease intangible .... 3,636 0 0
Stock-based expenses .................... 593,628 564,765 503,280
Amortization of debt discount, net .......... 24,504 36,575 46,728
Loss on conversion of debt ................ 0 10,326 214
Less:
Operating lease termination resulting from
purchase of 50 Fremont ................ (36,617) 0 0
Gain on sales of land and building
improvements ........................ (21,792) (15,625) 0
Income tax effects and adjustments of Non-
GAAP items ......................... (167,221) (146,741) (242,729)
Non-GAAP net income ...................... $506,782 $ 341,585 $ 221,853
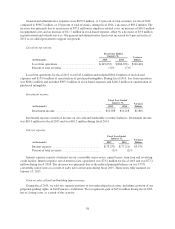
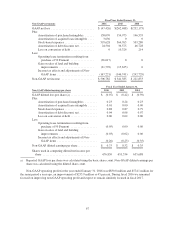
Fiscal Year Ended January 31,
Non-GAAP diluted earnings per share 2016 2015 2014
GAAP diluted loss per share (a) .................. $ (0.07) $ (0.42) $ (0.39)
Plus:
Amortization of purchased intangibles ........ 0.23 0.24 0.23
Amortization of acquired lease intangible ...... 0.01 0.00 0.00
Stock-based expenses ...................... 0.88 0.87 0.79
Amortization of debt discount, net ............ 0.04 0.06 0.07
Loss on conversion of debt .................. 0.00 0.02 0.00
Less:
Operating lease termination resulting from
purchase of 50 Fremont .................. (0.05) 0.00 0.00
Gain on sales of land and building
improvements .......................... (0.03) (0.02) 0.00
Income tax effects and adjustments of Non-
GAAP items ........................... (0.26) (0.23) (0.35)
Non-GAAP diluted earnings per share ............. $ 0.75 $ 0.52 $ 0.35
Shares used in computing diluted net income per
share ..................................... 676,830 651,534 635,688
a) Reported GAAP loss per share was calculated using the basic share count. Non-GAAP diluted earnings per
share was calculated using the diluted share count.
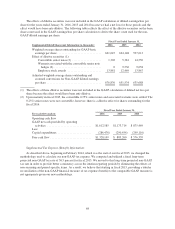
Non-GAAP operating profit for the year ended January 31, 2016 was $830.0 million and $574.1 million for
the same period a year ago, an improvement of $255.9 million or 45 percent. During fiscal 2016 we remained
focused on improving non-GAAP operating profit and expect to remain similarly focused in fiscal 2017.
67