Salesforce.com 2016 Annual Report Download - page 61
Download and view the complete annual report
Please find page 61 of the 2016 Salesforce.com annual report below. You can navigate through the pages in the report by either clicking on the pages listed below, or by using the keyword search tool below to find specific information within the annual report.-
 1
1 -
2
-
3
-
4
-
5
-
6
-
7
-
8
-
9
-
10
-
11
-
12
-
13
-
14
-
15
-
16
-
17
-
18
-
19
-
20
-
21
-
22
-
23
-
24
-
25
-
26
-
27
-
28
-
29
-
30
-
31
-
32
-
33
-
34
-
35
-
36
-
37
-
38
-
39
-
40
-
41
-
42
-
43
-
44
-
45
-
46
-
47
-
48
-
49
-
50
-
 51
51 -
 52
52 -
 53
53 -
 54
54 -
 55
55 -
 56
56 -
 57
57 -
 58
58 -
 59
59 -
 60
60 -
 61
61 -
 62
62 -
 63
63 -
 64
64 -
 65
65 -
 66
66 -
 67
67 -
 68
68 -
 69
69 -
 70
70 -
 71
71 -
72
-
73
-
74
-
75
-
76
-
77
-
78
-
79
-
80
-
81
-
82
-
83
-
84
-
85
-
86
-
87
-
88
-
89
-
90
-
91
-
92
-
93
-
94
-
95
-
96
-
97
-
98
-
99
-
100
-
101
-
102
-
103
-
104
-
105
-
106
-
107
-
108
-
109
-
110
-
111
-
112
-
113
-
114
-
115
-
116
-
117
-
118
-
119
-
120
-
121
-
122
-
123
-
124
-
125
-
126
-
127
-
128
-
129
-
130
-
131
-
132
-
133
-
134
-
135
-
136
-
137
-
138
 |
 |

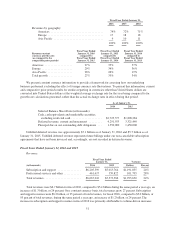
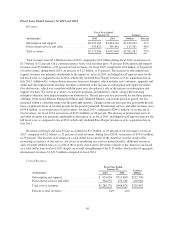
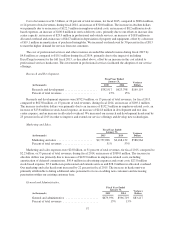
Operating lease termination resulting from purchase of 50 Fremont.
Fiscal Year Ended
January 31, Variance
Dollars(in thousands) 2016 2015
Operating lease termination resulting from purchase of 50
Fremont ........................................ $(36,617) $0 (36,617)
Percent of total revenues ............................. (1)% 0%
Operating lease termination resulting from purchase of 50 Fremont for fiscal 2016 was $36.6 million. In
connection with the purchase, we recognized a net non-cash gain totaling approximately $36.6 million on the
termination of the lease signed in January 2012.
Income (loss) from operations.
Fiscal Year Ended
January 31, Variance
Dollars(in thousands) 2016 2015
Income (loss) from operations .................. $114,923 $(145,633) $260,556
Percent of total revenues ....................... 2% (3)%
Income (loss) from operations for fiscal 2016 was $114.9 million and included $593.6 million of stock-
based expenses and $158.1 million of amortization of purchased intangibles. During the same period a year ago,
loss from operations was $145.6 million and included $564.8 million of stock-based expenses and $155.0 million
of amortization of purchased intangibles. The increase in income from operations is primarily due to a higher
revenue growth rate compared to the operating expense growth rate.
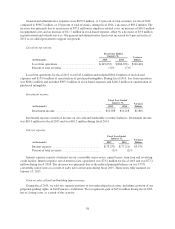
Investment income.
Fiscal Year Ended
January 31, Variance
Dollars(in thousands) 2016 2015
Investment income ............................... $15,341 $10,038 $5,303
Investment income consists of income on our cash and marketable securities balances. Investment income
was $15.3 million for fiscal 2016 and was $10.0 million during the same period a year ago. The increase was
primarily due to the increase in cash, cash equivalent and marketable securities balances.
Interest expense.
Fiscal Year Ended
January 31, Variance
Dollars(in thousands) 2016 2015
Interest expense ................................ $(72,485) $(73,237) $752
Percent of total revenues ......................... (1)% (1)%
Interest expense consists of interest on our convertible senior notes, capital leases, term loan and revolving
credit facility. Interest expense, net of interest costs capitalized, was $72.5 million for fiscal 2016 and was $73.2
million during the same period a year ago. The decrease was primarily due to the payment of our revolving credit
facility in 2015.
54