Salesforce.com 2016 Annual Report Download - page 57
Download and view the complete annual report
Please find page 57 of the 2016 Salesforce.com annual report below. You can navigate through the pages in the report by either clicking on the pages listed below, or by using the keyword search tool below to find specific information within the annual report.-
 1
1 -
2
-
3
-
4
-
5
-
6
-
7
-
8
-
9
-
10
-
11
-
12
-
13
-
14
-
15
-
16
-
17
-
18
-
19
-
20
-
21
-
22
-
23
-
24
-
25
-
26
-
27
-
28
-
29
-
30
-
31
-
32
-
33
-
34
-
35
-
36
-
37
-
38
-
39
-
40
-
41
-
42
-
43
-
44
-
45
-
46
-
 47
47 -
 48
48 -
 49
49 -
 50
50 -
 51
51 -
 52
52 -
 53
53 -
 54
54 -
 55
55 -
 56
56 -
 57
57 -
 58
58 -
 59
59 -
 60
60 -
 61
61 -
 62
62 -
 63
63 -
 64
64 -
 65
65 -
 66
66 -
 67
67 -
68
-
69
-
70
-
71
-
72
-
73
-
74
-
75
-
76
-
77
-
78
-
79
-
80
-
81
-
82
-
83
-
84
-
85
-
86
-
87
-
88
-
89
-
90
-
91
-
92
-
93
-
94
-
95
-
96
-
97
-
98
-
99
-
100
-
101
-
102
-
103
-
104
-
105
-
106
-
107
-
108
-
109
-
110
-
111
-
112
-
113
-
114
-
115
-
116
-
117
-
118
-
119
-
120
-
121
-
122
-
123
-
124
-
125
-
126
-
127
-
128
-
129
-
130
-
131
-
132
-
133
-
134
-
135
-
136
-
137
-
138
 |
 |

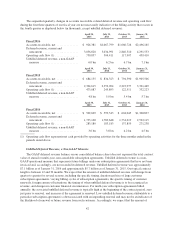
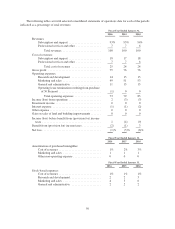
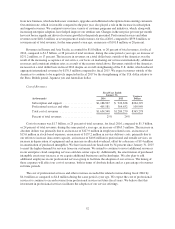
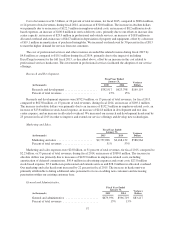
The following tables set forth selected consolidated statements of operations data for each of the periods
indicated as a percentage of total revenues:
Fiscal Year Ended January 31,
2016 2015 2014
Revenues:
Subscription and support ...................... 93% 93% 94%
Professional services and other ................. 7 7 6
Total revenues .......................... 100 100 100
Cost of revenues:
Subscription and support ...................... 18 17 18
Professional services and other ................. 7 7 6
Total cost of revenues .................... 25 24 24
Gross profit .................................... 75 76 76
Operating expenses:
Research and development .................... 14 15 15
Marketing and sales .......................... 49 51 53
General and administrative .................... 11 13 15
Operating lease termination resulting from purchase
of 50 Fremont ............................. (1) 0 0
Total operating expenses .................. 73 79 83
Income (loss) from operations ...................... 2 (3) (7)
Investment income ............................... 0 0 0
Interest expense ................................. (1) (1) (2)
Other expense ................................... 0 0 0
Gain on sales of land and building improvements ....... 0 0 0
Income (loss) before benefit from (provision for) income
taxes ........................................ 1 (4) (9)
Benefit from (provision for) income taxes ............. (2) (1) 3
Net loss ........................................ (1)% (5)% (6)%
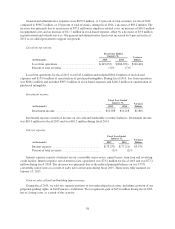
Fiscal Year Ended January 31,
2016 2015 2014
Amortization of purchased intangibles:
Cost of revenues ............................. 1% 2% 3%
Marketing and sales .......................... 1 1 1
Other non-operating expense ................... 0 0 0
Fiscal Year Ended January 31,
2016 2015 2014
Stock-based expenses:
Cost of revenues ............................. 1% 1% 1%
Research and development ..................... 2 2 3
Marketing and sales .......................... 4 5 6
General and administrative .................... 2 2 2
50