Salesforce.com 2016 Annual Report Download - page 106
Download and view the complete annual report
Please find page 106 of the 2016 Salesforce.com annual report below. You can navigate through the pages in the report by either clicking on the pages listed below, or by using the keyword search tool below to find specific information within the annual report.-
 1
1 -
2
-
3
-
4
-
5
-
6
-
7
-
8
-
9
-
10
-
11
-
12
-
13
-
14
-
15
-
16
-
17
-
18
-
19
-
20
-
21
-
22
-
23
-
24
-
25
-
26
-
27
-
28
-
29
-
30
-
31
-
32
-
33
-
34
-
35
-
36
-
37
-
38
-
39
-
40
-
41
-
42
-
43
-
44
-
45
-
46
-
47
-
48
-
49
-
50
-
51
-
52
-
53
-
54
-
55
-
56
-
57
-
58
-
59
-
60
-
61
-
62
-
63
-
64
-
65
-
66
-
67
-
68
-
69
-
70
-
71
-
72
-
73
-
74
-
75
-
76
-
77
-
78
-
79
-
80
-
81
-
82
-
83
-
84
-
85
-
86
-
87
-
88
-
89
-
90
-
91
-
92
-
93
-
94
-
95
-
 96
96 -
 97
97 -
 98
98 -
 99
99 -
 100
100 -
 101
101 -
 102
102 -
 103
103 -
 104
104 -
 105
105 -
 106
106 -
 107
107 -
 108
108 -
 109
109 -
 110
110 -
 111
111 -
 112
112 -
 113
113 -
 114
114 -
 115
115 -
 116
116 -
117
-
118
-
119
-
120
-
121
-
122
-
123
-
124
-
125
-
126
-
127
-
128
-
129
-
130
-
131
-
132
-
133
-
134
-
135
-
136
-
137
-
138
 |
 |

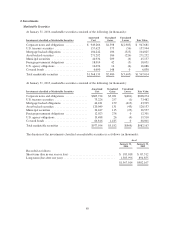
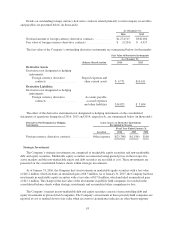
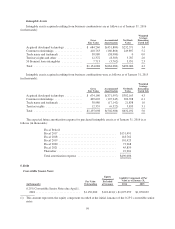
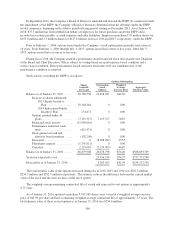
Intangible Assets
Intangible assets acquired resulting from business combinations are as follows as of January 31, 2016
(in thousands):
Gross
Fair Value
Accumulated
Amortization
Net Book
Value
Weighted
Average
Remaining
Useful Life
Acquired developed technology ............ $ 684,260 $(451,889) $232,371 3.4
Customer relationships ................... 410,763 (160,866) 249,897 5.2
Trade name and trademark ................ 38,980 (38,980) 0 0.0
Territory rights and other ................. 12,372 (8,585) 3,787 2.6
50 Fremont lease intangibles .............. 7,713 (3,762) 3,951 2.3
Total ................................. $1,154,088 $(664,082) $490,006 4.3
Intangible assets acquired resulting from business combinations were as follows as of January 31, 2015
(in thousands):
Gross
Fair Value
Accumulated
Amortization
Net Book
Value
Weighted
Average
Remaining
Useful Life
Acquired developed technology ............ $ 674,160 $(371,997) $302,163 4.3
Customer relationships ................... 409,603 (107,245) 302,358 6.1
Trade name and trademark ................ 38,980 (17,142) 21,838 1.0
Territory rights ......................... 12,355 (6,522) 5,833 3.1
Total ................................. $1,135,098 $(502,906) $632,192 5.0
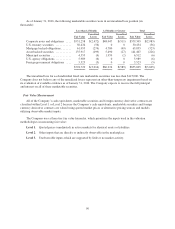
The expected future amortization expense for purchased intangible assets as of January 31, 2016 is as
follows (in thousands):
Fiscal Period:
Fiscal 2017 ....................................... $131,491
Fiscal 2018 ....................................... 118,762
Fiscal 2019 ....................................... 101,425
Fiscal 2020 ....................................... 73,268
Fiscal 2021 ....................................... 45,859
Thereafter ........................................ 19,201
Total amortization expense .......................... $490,006
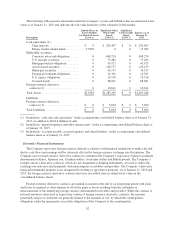
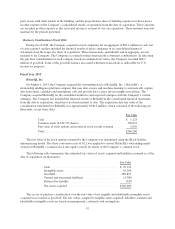
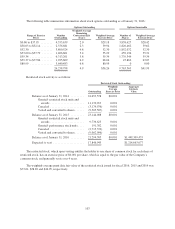
5. Debt
Convertible Senior Notes
(in thousands)
Par Value
Outstanding
Equity
Component
Recorded
at Issuance
Liability Component of Par
Value as of January 31,
2016 2015
0.25% Convertible Senior Notes due April 1,
2018 .............................. $1,150,000 $122,421(1) $1,095,059 $1,070,692
(1) This amount represents the equity component recorded at the initial issuance of the 0.25% convertible senior
notes.
99