Salesforce.com 2016 Annual Report Download - page 48
Download and view the complete annual report
Please find page 48 of the 2016 Salesforce.com annual report below. You can navigate through the pages in the report by either clicking on the pages listed below, or by using the keyword search tool below to find specific information within the annual report.-
 1
1 -
2
-
3
-
4
-
5
-
6
-
7
-
8
-
9
-
10
-
11
-
12
-
13
-
14
-
15
-
16
-
17
-
18
-
19
-
20
-
21
-
22
-
23
-
24
-
25
-
26
-
27
-
28
-
29
-
30
-
31
-
32
-
33
-
34
-
35
-
36
-
37
-
 38
38 -
 39
39 -
 40
40 -
 41
41 -
 42
42 -
 43
43 -
 44
44 -
 45
45 -
 46
46 -
 47
47 -
 48
48 -
 49
49 -
 50
50 -
 51
51 -
 52
52 -
 53
53 -
 54
54 -
 55
55 -
 56
56 -
 57
57 -
 58
58 -
59
-
60
-
61
-
62
-
63
-
64
-
65
-
66
-
67
-
68
-
69
-
70
-
71
-
72
-
73
-
74
-
75
-
76
-
77
-
78
-
79
-
80
-
81
-
82
-
83
-
84
-
85
-
86
-
87
-
88
-
89
-
90
-
91
-
92
-
93
-
94
-
95
-
96
-
97
-
98
-
99
-
100
-
101
-
102
-
103
-
104
-
105
-
106
-
107
-
108
-
109
-
110
-
111
-
112
-
113
-
114
-
115
-
116
-
117
-
118
-
119
-
120
-
121
-
122
-
123
-
124
-
125
-
126
-
127
-
128
-
129
-
130
-
131
-
132
-
133
-
134
-
135
-
136
-
137
-
138
 |
 |
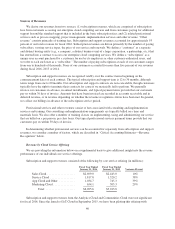
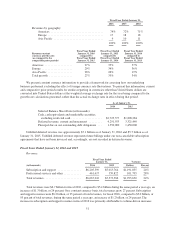
several enterprises. Analytics Cloud revenue is included with App Cloud and Other in the table above.
Communities Cloud revenue is included in either Sales Cloud, Service Cloud or App Cloud and Other revenue
depending on the primary service offering purchased.
In situations where a customer purchases multiple cloud offerings, such as through an Enterprise License
Agreement, we allocate the contract value to each core service offering based on the customer’s estimated
product demand plan and the service that was provided at the inception of the contract. We do not update these
allocations based on actual product usage during the term of the contract. We have allocated approximately 10
percent of our total subscription and support revenues for fiscal 2016 and 2015, based on customers’ estimated
product demand plans and these allocated amounts are included in the table above.
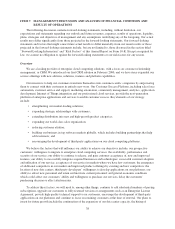
Additionally, some of our service offerings have similar features and functions. For example, customers
may use the Sales Cloud, the Service Cloud or our App Cloud to record account and contact information, which
are similar features across these core service offerings. Depending on a customer’s actual and projected business
requirements, more than one core service offering may satisfy the customer’s current and future needs. We
record revenue based on the individual products ordered by a customer, and not according to the customer’s
business requirements and usage. In addition, as we introduce new features and functions within each offering
and refine our allocation methodology for changes in our business, we do not expect it to be practical to adjust
historical revenue results by core service offering for comparability. Accordingly, comparisons of revenue
performance by service offering over time may not be meaningful.
Our Sales Cloud service offering is our most widely distributed service offering and has historically been
the largest contributor of subscription and support revenues. As a result, Sales Cloud has the most international
exposure and foreign exchange rate exposure, relative to the other cloud service offerings. Conversely, revenue
for Marketing Cloud is primarily derived from the Americas, with little impact from foreign exchange rate
movement. We estimate that for fiscal 2017, subscription and support revenues from the Sales Cloud service
offering will continue to be the largest contributor of subscription and support revenues, and foreign currency
will continue to have a more pronounced impact on Sales Cloud subscription and support revenues than revenues
from our other cloud service offerings.
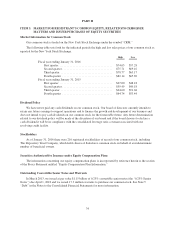
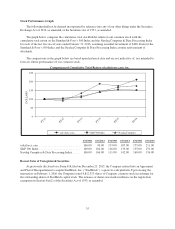
Seasonal Nature of Deferred Revenue, Accounts Receivable and Operating Cash Flow
Deferred revenue primarily consists of billings to customers for our subscription service. Over 90 percent of
the value of our billings to customers is for our subscription and support service. We generally invoice our
customers in annual cycles. Approximately 80 percent of all subscription and support invoices were issued with
annual terms during fiscal 2016, which is consistent with fiscal 2015. Occasionally, we bill customers for their
multi-year contract on a single invoice which results in an increase in noncurrent deferred revenue. We typically
issue renewal invoices in advance of the renewal service period, and depending on timing, the initial invoice for
the subscription and services contract and the subsequent renewal invoice may occur in different quarters. This
may result in an increase in deferred revenue and accounts receivable. There is a disproportionate weighting
towards annual billings in the fourth quarter, primarily as a result of large enterprise account buying patterns. Our
fourth quarter has historically been our strongest quarter for new business and renewals. The year on year
compounding effect of this seasonality in both billing patterns and overall new and renewal business causes the
value of invoices that we generate in the fourth quarter for both new business and renewals to increase as a
proportion of our total annual billings. Accordingly, because of this billing activity, our first quarter is our largest
collections and operating cash flow quarter.
41