Salesforce.com 2016 Annual Report Download - page 73
Download and view the complete annual report
Please find page 73 of the 2016 Salesforce.com annual report below. You can navigate through the pages in the report by either clicking on the pages listed below, or by using the keyword search tool below to find specific information within the annual report.-
 1
1 -
2
-
3
-
4
-
5
-
6
-
7
-
8
-
9
-
10
-
11
-
12
-
13
-
14
-
15
-
16
-
17
-
18
-
19
-
20
-
21
-
22
-
23
-
24
-
25
-
26
-
27
-
28
-
29
-
30
-
31
-
32
-
33
-
34
-
35
-
36
-
37
-
38
-
39
-
40
-
41
-
42
-
43
-
44
-
45
-
46
-
47
-
48
-
49
-
50
-
51
-
52
-
53
-
54
-
55
-
56
-
57
-
58
-
59
-
60
-
61
-
62
-
 63
63 -
 64
64 -
 65
65 -
 66
66 -
 67
67 -
 68
68 -
 69
69 -
 70
70 -
 71
71 -
 72
72 -
 73
73 -
 74
74 -
 75
75 -
 76
76 -
 77
77 -
 78
78 -
 79
79 -
 80
80 -
 81
81 -
 82
82 -
 83
83 -
84
-
85
-
86
-
87
-
88
-
89
-
90
-
91
-
92
-
93
-
94
-
95
-
96
-
97
-
98
-
99
-
100
-
101
-
102
-
103
-
104
-
105
-
106
-
107
-
108
-
109
-
110
-
111
-
112
-
113
-
114
-
115
-
116
-
117
-
118
-
119
-
120
-
121
-
122
-
123
-
124
-
125
-
126
-
127
-
128
-
129
-
130
-
131
-
132
-
133
-
134
-
135
-
136
-
137
-
138
 |
 |

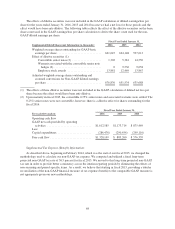
Non-GAAP free cash flow
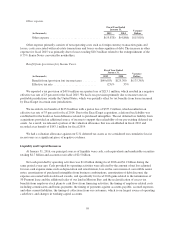
We define the non-GAAP measure free cash flow as GAAP net cash provided by operating activities, less
capital expenditures. For this purpose, capital expenditures does not include our strategic investments, nor does it
include any costs or activities related to our purchase of 50 Fremont land and building, and building in
progress—leased facilities.
Limitations on the use of non-GAAP financial measures
A limitation of our non-GAAP financial measures of non-GAAP gross profit, non-GAAP operating profit,
non-GAAP net income, non-GAAP earnings per share and non-GAAP free cash flow is that they do not have
uniform definitions. Our definitions will likely differ from the definitions used by other companies, including
peer companies, and therefore comparability may be limited. Thus, our non-GAAP measures of non-GAAP gross
profit, non-GAAP operating profit, non-GAAP net income, non-GAAP earnings per share and non-GAAP free
cash flow should be considered in addition to, not as a substitute for, or in isolation from, measures prepared in
accordance with GAAP. Additionally, in the case of stock-based expense, if we did not pay a portion of
compensation in the form of stock-based expense, the cash salary expense included in costs of revenues and
operating expenses would be higher which would affect our cash position.
We compensate for these limitations by reconciling our non-GAAP financial measures to the most
comparable GAAP financial measure. We encourage investors and others to review our financial information in
its entirety, not to rely on any single financial measure, and to view our non-GAAP financial measures in
conjunction with the most comparable GAAP financial measures.
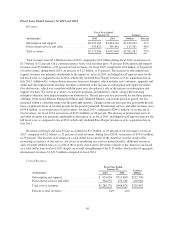
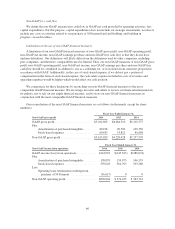
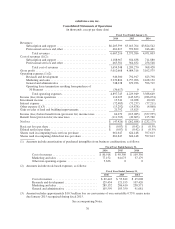
Our reconciliation of the non-GAAP financial measures are as follows (in thousands, except for share
numbers):
Fiscal Year Ended January 31,
Non-GAAP gross profit 2016 2015 2014
GAAP gross profit ........................ $5,012,668 $4,084,316 $3,102,575
Plus:
Amortization of purchased intangibles .... 80,918 90,300 109,356
Stock-based expenses ................. 69,443 53,812 45,608
Non-GAAP gross profit ................... $5,163,029 $4,228,428 $3,257,539
Fiscal Year Ended January 31,
Non-GAAP income from operations 2016 2015 2014
GAAP income (loss) from operations ............ $114,923 $(145,633) $(286,074)
Plus:
Amortization of purchased intangibles ....... 158,070 154,973 146,535
Stock-based expenses .................... 593,628 564,765 503,280
Less:
Operating lease termination resulting from
purchase of 50 Fremont ................. (36,617) 0 0
Non-GAAP operating profit ................... $830,004 $ 574,105 $ 363,741
66