Salesforce.com 2016 Annual Report Download - page 65
Download and view the complete annual report
Please find page 65 of the 2016 Salesforce.com annual report below. You can navigate through the pages in the report by either clicking on the pages listed below, or by using the keyword search tool below to find specific information within the annual report.-
 1
1 -
2
-
3
-
4
-
5
-
6
-
7
-
8
-
9
-
10
-
11
-
12
-
13
-
14
-
15
-
16
-
17
-
18
-
19
-
20
-
21
-
22
-
23
-
24
-
25
-
26
-
27
-
28
-
29
-
30
-
31
-
32
-
33
-
34
-
35
-
36
-
37
-
38
-
39
-
40
-
41
-
42
-
43
-
44
-
45
-
46
-
47
-
48
-
49
-
50
-
51
-
52
-
53
-
54
-
 55
55 -
 56
56 -
 57
57 -
 58
58 -
 59
59 -
 60
60 -
 61
61 -
 62
62 -
 63
63 -
 64
64 -
 65
65 -
 66
66 -
 67
67 -
 68
68 -
 69
69 -
 70
70 -
 71
71 -
 72
72 -
 73
73 -
 74
74 -
 75
75 -
76
-
77
-
78
-
79
-
80
-
81
-
82
-
83
-
84
-
85
-
86
-
87
-
88
-
89
-
90
-
91
-
92
-
93
-
94
-
95
-
96
-
97
-
98
-
99
-
100
-
101
-
102
-
103
-
104
-
105
-
106
-
107
-
108
-
109
-
110
-
111
-
112
-
113
-
114
-
115
-
116
-
117
-
118
-
119
-
120
-
121
-
122
-
123
-
124
-
125
-
126
-
127
-
128
-
129
-
130
-
131
-
132
-
133
-
134
-
135
-
136
-
137
-
138
 |
 |

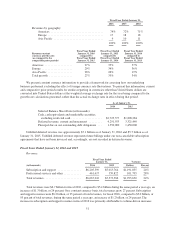
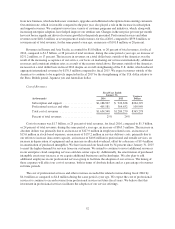
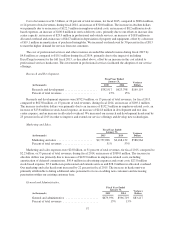
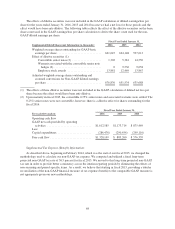
General and administrative expenses were $679.9 million, or 13 percent of total revenues, for fiscal 2015,
compared to $596.7 million, or 15 percent of total revenues, during fiscal 2014, a increase of $83.2 million. The
increase was primarily due to an increase of $53.1 million in employee-related costs, an increase of $18.9 million
in equipment costs and an increase of $11.7 million in stock-based expense, offset by a decrease of $3.0 million
in professional and outside services. Our general and administrative headcount increased by 9 percent in fiscal
2015 as we added personnel to support our growth.
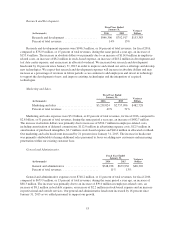
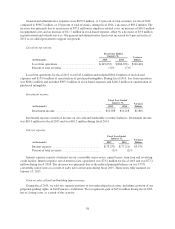
Loss from operations.
Fiscal Year Ended
January 31, Variance
Dollars(in thousands) 2015 2014
Loss from operations ......................... $(145,633) $(286,074) $140,441
Percent of total revenues ...................... (3)% (7)%
Loss from operations for fiscal 2015 was $145.6 million and included $564.8 million of stock-based
expenses and $155.0 million of amortization of purchased intangibles. During fiscal 2014, loss from operations
was $286.1 million and included $503.3 million of stock-based expenses and $146.5 million of amortization of
purchased intangibles.
Investment income.
Fiscal Year Ended
January 31, Variance
Dollars(in thousands) 2015 2014
Investment income ............................... $10,038 $10,218 $(180)
Investment income consists of income on our cash and marketable securities balances. Investment income
was $10.0 million for fiscal 2015 and was $10.2 million during fiscal 2014.
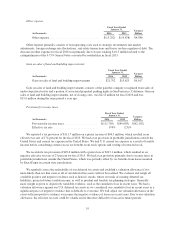
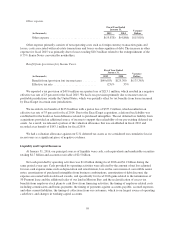
Interest expense.
Fiscal Year Ended
January 31, Variance
Dollars(in thousands) 2015 2014
Interest expense ................................ $(73,237) $(77,211) $3,974
Percent of total revenues ......................... (1)% (2)%
Interest expense consists of interest on our convertible senior notes, capital leases, term loan and revolving
credit facility. Interest expense, net of interest costs capitalized, was $73.2 million for fiscal 2015 and was $77.2
million during fiscal 2014. The decrease was primarily due to the reduced principal balance on our 0.75%
convertible senior notes as a result of early note conversions during fiscal 2015. These notes fully matured on
January 15, 2015.
Gain on sales of land and building improvements.
During fiscal 2015, we sold two separate portions of our undeveloped real estate, including a portion of our
perpetual parking rights, in San Francisco, California. We recognized a gain of $15.6 million during fiscal 2015,
net of closing costs, as a result of this activity.
58