Salesforce.com 2016 Annual Report Download - page 44
Download and view the complete annual report
Please find page 44 of the 2016 Salesforce.com annual report below. You can navigate through the pages in the report by either clicking on the pages listed below, or by using the keyword search tool below to find specific information within the annual report.-
 1
1 -
2
-
3
-
4
-
5
-
6
-
7
-
8
-
9
-
10
-
11
-
12
-
13
-
14
-
15
-
16
-
17
-
18
-
19
-
20
-
21
-
22
-
23
-
24
-
25
-
26
-
27
-
28
-
29
-
30
-
31
-
32
-
33
-
 34
34 -
 35
35 -
 36
36 -
 37
37 -
 38
38 -
 39
39 -
 40
40 -
 41
41 -
 42
42 -
 43
43 -
 44
44 -
 45
45 -
 46
46 -
 47
47 -
 48
48 -
 49
49 -
 50
50 -
 51
51 -
 52
52 -
 53
53 -
 54
54 -
55
-
56
-
57
-
58
-
59
-
60
-
61
-
62
-
63
-
64
-
65
-
66
-
67
-
68
-
69
-
70
-
71
-
72
-
73
-
74
-
75
-
76
-
77
-
78
-
79
-
80
-
81
-
82
-
83
-
84
-
85
-
86
-
87
-
88
-
89
-
90
-
91
-
92
-
93
-
94
-
95
-
96
-
97
-
98
-
99
-
100
-
101
-
102
-
103
-
104
-
105
-
106
-
107
-
108
-
109
-
110
-
111
-
112
-
113
-
114
-
115
-
116
-
117
-
118
-
119
-
120
-
121
-
122
-
123
-
124
-
125
-
126
-
127
-
128
-
129
-
130
-
131
-
132
-
133
-
134
-
135
-
136
-
137
-
138
 |
 |

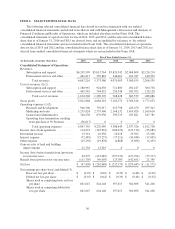
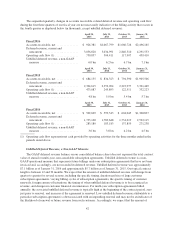
(1) Amounts include amortization of purchased
intangibles from business combinations, as
follows:
Cost of revenues .......................... $ 80,918 $ 90,300 $109,356 $ 77,249 $ 60,069
Marketing and sales ....................... 77,152 64,673 37,179 10,922 7,250
Other non-operating expense ................ 3,6360000
(2) Amounts include stock-based expenses, as
follows:
Cost of revenues .......................... $ 69,443 $ 53,812 $ 45,608 $ 33,757 $ 17,451
Research and development .................. 129,434 121,193 107,420 76,333 45,894
Marketing and sales ....................... 289,152 286,410 258,571 199,284 115,730
General and administrative ................. 105,599 103,350 91,681 69,976 50,183
(3) Fiscal 2013 and 2012 have been adjusted to reflect the four-for-one stock split effected through a stock
dividend which occurred in April 2013.
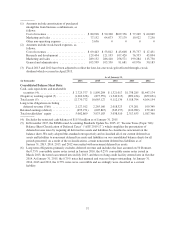
As of January 31,
(in thousands) 2016 2015 2014 2013 2012
Consolidated Balance Sheet Data:
Cash, cash equivalents and marketable
securities (4) ..................... $ 2,725,377 $ 1,890,284 $ 1,321,017 $1,758,285 $1,447,174
(Negative) working capital (5) ......... (1,269,678) (875,559) (1,349,215) (899,434) (659,631)
Total assets (5) ..................... 12,770,772 10,665,127 9,112,136 5,518,794 4,164,154
Long-term obligations excluding
deferred revenue (5)(6) ............ 2,127,012 2,265,160 2,018,323 175,201 109,349
Retained earnings (deficit) ............ (653,271) (605,845) (343,157) (110,982) 159,463
Total stockholders’ equity ............ 5,002,869 3,975,183 3,038,510 2,317,633 1,587,360
(4) Excludes the restricted cash balance of $115.0 million as of January 31, 2015.
(5) In November 2015, the FASB issued Accounting Standards Update No. 2015-17, “Income Taxes (Topic 740):
Balance Sheet Classification of Deferred Taxes” (“ASU 2015-17”), which simplifies the presentation of
deferred income taxes by requiring all deferred tax assets and liabilities be classified as noncurrent on the
balance sheet. We early adopted this standard retrospectively and reclassified all of our current deferred tax
assets and liabilities to noncurrent deferred tax assets and liabilities on our consolidated balance sheets for all
periods presented. As a result of the reclassifications, certain noncurrent deferred tax liabilities as of
January 31, 2015, 2014, 2013, and 2012 were netted with noncurrent deferred tax assets.
(6) Long-term obligations primarily excludes deferred revenue and includes the loan assumed on 50 Fremont,
the 0.75% convertible senior notes issued in January 2010, the 0.25% convertible senior notes issued in
March 2013, the term loan entered into in July 2013, and the revolving credit facility entered into in October
2014. At January 31, 2015, the 0.75% notes had matured and were no longer outstanding. At January 31,
2014, 2013 and 2012, the 0.75% notes were convertible and accordingly were classified as a current
liability.
37