Salesforce.com 2016 Annual Report Download - page 55
Download and view the complete annual report
Please find page 55 of the 2016 Salesforce.com annual report below. You can navigate through the pages in the report by either clicking on the pages listed below, or by using the keyword search tool below to find specific information within the annual report.-
 1
1 -
2
-
3
-
4
-
5
-
6
-
7
-
8
-
9
-
10
-
11
-
12
-
13
-
14
-
15
-
16
-
17
-
18
-
19
-
20
-
21
-
22
-
23
-
24
-
25
-
26
-
27
-
28
-
29
-
30
-
31
-
32
-
33
-
34
-
35
-
36
-
37
-
38
-
39
-
40
-
41
-
42
-
43
-
44
-
 45
45 -
 46
46 -
 47
47 -
 48
48 -
 49
49 -
 50
50 -
 51
51 -
 52
52 -
 53
53 -
 54
54 -
 55
55 -
 56
56 -
 57
57 -
 58
58 -
 59
59 -
 60
60 -
 61
61 -
 62
62 -
 63
63 -
 64
64 -
 65
65 -
66
-
67
-
68
-
69
-
70
-
71
-
72
-
73
-
74
-
75
-
76
-
77
-
78
-
79
-
80
-
81
-
82
-
83
-
84
-
85
-
86
-
87
-
88
-
89
-
90
-
91
-
92
-
93
-
94
-
95
-
96
-
97
-
98
-
99
-
100
-
101
-
102
-
103
-
104
-
105
-
106
-
107
-
108
-
109
-
110
-
111
-
112
-
113
-
114
-
115
-
116
-
117
-
118
-
119
-
120
-
121
-
122
-
123
-
124
-
125
-
126
-
127
-
128
-
129
-
130
-
131
-
132
-
133
-
134
-
135
-
136
-
137
-
138
 |
 |

securities are recorded at fair value only if an impairment is recognized. The measurement of fair value requires
significant judgment and includes a qualitative and quantitative analysis of events and circumstances that impact
the fair value of the investment. Our assessment of the severity and duration of the impairment and qualitative
and quantitative analysis includes the investee’s financial metrics, the investee’s products and technologies
meeting or exceeding predefined milestones, market acceptance of the product or technology, other competitive
products or technology in the market, general market conditions, management and governance structure of the
investee, investee’s liquidity, debt ratios and the rate at which the investee is using its cash, and investee’s receipt
of additional funding at a lower valuation. In determining the estimated fair value of our strategic investments in
privately held companies, we utilize the most recent data available to us. Valuations of privately held companies
are inherently complex due to the lack of readily available market data.
If the fair value of an investment is below our cost, we determine whether the investment is other-than-
temporarily impaired based on our qualitative and quantitative analysis, which includes the severity and duration
of the impairment. If the investment is considered to be other-than-temporarily impaired, we record the
investment at fair value by recognizing an impairment through the income statement and establishing a new cost
basis for the investment.
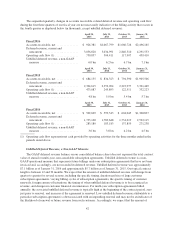
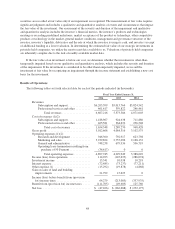
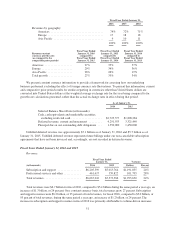
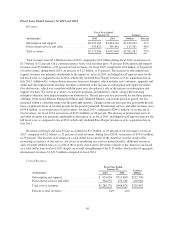
Results of Operations
The following tables set forth selected data for each of the periods indicated (in thousands):
Fiscal Year Ended January 31,
2016 2015 2014
Revenues:
Subscription and support ............... $6,205,599 $5,013,764 $3,824,542
Professional services and other .......... 461,617 359,822 246,461
Total revenues ................... 6,667,216 5,373,586 4,071,003
Cost of revenues (1)(2):
Subscription and support ............... 1,188,967 924,638 711,880
Professional services and other .......... 465,581 364,632 256,548
Total cost of revenues ............. 1,654,548 1,289,270 968,428
Gross profit ............................. 5,012,668 4,084,316 3,102,575
Operating expenses (1)(2):
Research and development ............. 946,300 792,917 623,798
Marketing and sales ................... 3,239,824 2,757,096 2,168,132
General and administrative ............. 748,238 679,936 596,719
Operating lease termination resulting from
purchase of 50 Fremont .............. (36,617) 0 0
Total operating expenses ........... 4,897,745 4,229,949 3,388,649
Income (loss) from operations .............. 114,923 (145,633) (286,074)
Investment income ....................... 15,341 10,038 10,218
Interest expense .......................... (72,485) (73,237) (77,211)
Other expense (1) ........................ (15,292) (19,878) (4,868)
Gain on sales of land and building
improvements ......................... 21,792 15,625 0
Income (loss) before benefit from (provision
for) income taxes ....................... 64,279 (213,085) (357,935)
Benefit from (provision for) income taxes ..... (111,705) (49,603) 125,760
Net loss ................................ $ (47,426) $ (262,688) $ (232,175)
48