Safeway 2005 Annual Report Download - page 78
Download and view the complete annual report
Please find page 78 of the 2005 Safeway annual report below. You can navigate through the pages in the report by either clicking on the pages listed below, or by using the keyword search tool below to find specific information within the annual report.-
 1
1 -
2
-
3
-
4
-
5
-
6
-
7
-
8
-
9
-
10
-
11
-
12
-
13
-
14
-
15
-
16
-
17
-
18
-
19
-
20
-
21
-
22
-
23
-
24
-
25
-
26
-
27
-
28
-
29
-
30
-
31
-
32
-
33
-
34
-
35
-
36
-
37
-
38
-
39
-
40
-
41
-
42
-
43
-
44
-
45
-
46
-
47
-
48
-
49
-
50
-
51
-
52
-
53
-
54
-
55
-
56
-
57
-
58
-
59
-
60
-
61
-
62
-
63
-
64
-
65
-
66
-
67
-
 68
68 -
 69
69 -
 70
70 -
 71
71 -
 72
72 -
 73
73 -
 74
74 -
 75
75 -
 76
76 -
 77
77 -
 78
78 -
 79
79 -
 80
80 -
 81
81 -
 82
82 -
 83
83 -
 84
84 -
 85
85 -
 86
86 -
 87
87 -
 88
88 -
89
-
90
-
91
-
92
-
93
-
94
-
95
-
96
 |
 |

SAFEWAY INC. AND SUBSIDIARIES
Notes to Consolidated Financial Statements
58
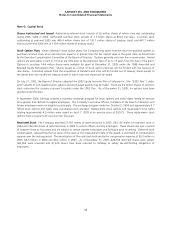
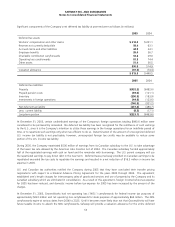
Furr’s and Homeland Lease Liabilities In 1987, Safeway assigned a number of leases to Furr’s Inc. (“Furr’s”) and
Homeland Stores, Inc. (“Homeland”) as part of the sale of the Company’s former El Paso, Texas and Oklahoma City,
Oklahoma divisions. Safeway is contingently liable if Furr’s and Homeland are unable to continue making rental payments on
these leases. In 2002, Furr’s began the liquidation process and Homeland emerged from bankruptcy. At year-end 2005,
Safeway has $14.8 million recorded as the estimated lease liabilities associated with Furr’s and Homeland bankruptcies.
Safeway is unable to determine the potential obligation with respect to other divested operations, should there be any similar
defaults, because information about the total numbers of leases from these divestitures that are still outstanding is not
available. Based on an internal assessment by the Company, performed by taking the original inventory of assigned leases at
the time of the divestitures and accounting for the passage of time, Safeway expects that any potential losses beyond those
recorded, should there be any similar defaults, would not be material to Safeway’s operating results, cash flow or financial
position.
Commitments The Company has commitments under contracts for the purchase of property and equipment and for the
construction of buildings. Portions of such contracts not completed at year-end are not reflected in the consolidated
financial statements. These unrecorded commitments were $201.0 million at year-end 2005.
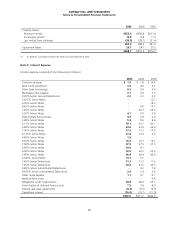
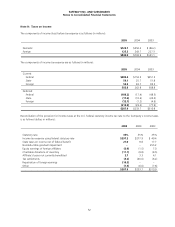
Note L: Segments
Safeway’s retail business, which represents more than 98% of consolidated sales and other revenue and operates in the U.S.
and Canada, is its only reportable segment.
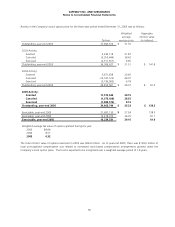
The following table presents information about the Company by geographic area (in millions):
U.S. Canada Total
2005
Sales and other revenue $33,568.8 $4,847.2 $38,416.0
Operating profit 1,090.9 123.8 1,214.7
Income before income taxes (1) 723.7 125.3 849.0
Long-lived assets, net 8,028.0 1,069.1 9,097.1
Total assets 14,141.2 1,615.7 15,756.9
2004
Sales and other revenue $31,463.0 $4,359.9 $35,822.9
Operating profit 928.9 243.9 1,172.8
Income before income taxes 550.2 243.7 793.9
Long-lived assets, net 7,796.9 892.5 8,689.4
Total assets 13,753.5 1,623.9 15,377.4
2003
Sales and other revenue $31,678.7 $4,048.5 $35,727.2
Operating profit 344.1 229.8 573.9
(Loss) income before income taxes (86.2) 227.3 141.1
Long-lived assets, net 7,607.9 797.9 8,405.8
Total assets 13,679.8 1,416.9 15,096.7
(1) As a result of the Advance Pricing Agreement negotiated in 2005 (see Note H), Canada income before tax expense for
2005 has been reduced, and U.S. income before tax expense for 2005 has been increased by intercompany charges
which are eliminated in consolidation.