Safeway 2005 Annual Report Download - page 44
Download and view the complete annual report
Please find page 44 of the 2005 Safeway annual report below. You can navigate through the pages in the report by either clicking on the pages listed below, or by using the keyword search tool below to find specific information within the annual report.-
 1
1 -
2
-
3
-
4
-
5
-
6
-
7
-
8
-
9
-
10
-
11
-
12
-
13
-
14
-
15
-
16
-
17
-
18
-
19
-
20
-
21
-
22
-
23
-
24
-
25
-
26
-
27
-
28
-
29
-
30
-
31
-
32
-
33
-
 34
34 -
 35
35 -
 36
36 -
 37
37 -
 38
38 -
 39
39 -
 40
40 -
 41
41 -
 42
42 -
 43
43 -
 44
44 -
 45
45 -
 46
46 -
 47
47 -
 48
48 -
 49
49 -
 50
50 -
 51
51 -
 52
52 -
 53
53 -
 54
54 -
55
-
56
-
57
-
58
-
59
-
60
-
61
-
62
-
63
-
64
-
65
-
66
-
67
-
68
-
69
-
70
-
71
-
72
-
73
-
74
-
75
-
76
-
77
-
78
-
79
-
80
-
81
-
82
-
83
-
84
-
85
-
86
-
87
-
88
-
89
-
90
-
91
-
92
-
93
-
94
-
95
-
96
 |
 |
SAFEWAY INC. AND SUBSIDIARIES
Management’s Discussion and Analysis of
Financial Condition and Results of Operations
24
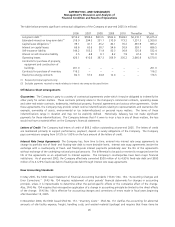
Liquidity and Financial Resources
Net cash flow from operating activities was $1,881.0 million in 2005, $2,226.4 million in 2004 and $1,609.6 million in 2003.
Working capital contributed to cash flow in 2005, but at a lower level than in 2004. Net cash flow from operating activities
increased in 2004 largely due to increased net income and changes in working capital. Net cash flow from operating
activities decreased in 2003 primarily due to lower operating results and changes in working capital.
Cash flow used by investing activities was $1,313.5 million in 2005, $1,070.3 million in 2004 and $795.0 million in 2003.
Cash flow used by investing activities increased in 2005 compared to 2004 because of higher capital expenditures and lower
proceeds from the sale of property. Cash flow used by investing activities increased in 2004 compared to 2003 because of
higher capital expenditures.
Capital expenditures were gradually scaled back in 2003 as the economy softened and as the Company was developing and
testing what is now the Lifestyle store concept. Capital expenditures increased in 2004 and 2005 as the Company focused
on remodeling its existing stores under its Lifestyle store format. In 2005, the Company opened 21 new Lifestyle stores and
completed 293 Lifestyle store remodels. The Company also completed 22 other remodels. In 2004, Safeway opened 32
new Lifestyle stores, completed 92 Lifestyle remodels and also completed another 23 remodels. In 2003, Safeway opened 40
new stores, one in the Lifestyle store format, and remodeled 75 stores, 19 in the Lifestyle store format. In 2006, Safeway
expects to spend approximately $1.6 billion in cash capital expenditures, open approximately 20 to 25 new Lifestyle stores
and complete approximately 280 Lifestyle remodels.
Cash used by financing activities, which consisted principally of cash used to pay down debt, was $466.9 million in 2005,
$1,077.6 million in 2004 and $724.0 million in 2003.
The Company has income tax-related contingencies that may result in significant cash inflows or outflows. Management is
uncertain as to when or in what amounts these matters may be resolved. The Company currently anticipates that it will use
excess cash flows, if any, to repay debt and/or repurchase common stock.
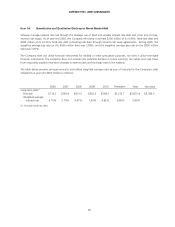
On June 1, 2005, the Company entered into a $1,600.0 million credit agreement (the “Credit Agreement”) with a syndicate
of banks. The Credit Agreement provides (1) to Safeway a $1,350.0 million, five-year, revolving credit facility (the “Domestic
Facility”), (2) to Safeway and Canada Safeway Limited (“CSL”) a Canadian facility of up to $250.0 million for U.S. Dollar and
Canadian Dollar advances and (3) to Safeway a $400.0 million sub-facility of the Domestic Facility for issuance of standby
and commercial letters of credit. The Credit Agreement also provides for an increase in the credit facility commitments up to
an additional $500.0 million, subject to the satisfaction of certain conditions. The restrictive covenants of the Credit
Agreement limit Safeway with respect to, among other things, creating liens upon its assets and disposing of material
amounts of assets other than in the ordinary course of business. The Credit Agreement is scheduled to expire on June 1,
2010; it replaced the former credit agreement that was scheduled to expire in 2006. As of December 31, 2005, outstanding
borrowings and letters of credit were $47.5 million and $38.4 million, respectively, under this agreement. Total unused
borrowing capacity under the Credit Agreement was $1,514.1 million as of December 31, 2005. Additionally, the Company
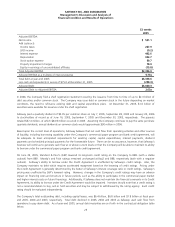
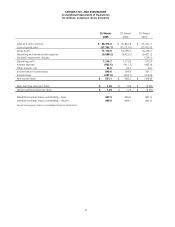
is required to maintain a minimum Adjusted EBITDA, as defined in the Credit Agreement, to interest expense ratio of 2.0 to 1
and not exceed an Adjusted Debt (total consolidated debt less cash and cash equivalents in excess of $75.0 million) to
Adjusted EBITDA ratio of 3.5 to 1. As of December 31, 2005, the Company was in compliance with the covenant
requirements. The computation of Adjusted EBITDA, as defined by the Credit Agreement, is provided below solely to provide
an understanding of the impact that Adjusted EBITDA has on Safeway’s ability to borrow under the bank credit agreement.
Adjusted EBITDA should not be considered as an alternative to net income or cash flow from operating activities (which are
determined in accordance with GAAP) as an indicator of operating performance or a measure of liquidity. Other companies
may define Adjusted EBITDA differently and, as a result, such measures may not be comparable to Safeway’s Adjusted
EBITDA (dollars in millions).