Safeway 2005 Annual Report Download - page 4
Download and view the complete annual report
Please find page 4 of the 2005 Safeway annual report below. You can navigate through the pages in the report by either clicking on the pages listed below, or by using the keyword search tool below to find specific information within the annual report.-
 1
1 -
 2
2 -
 3
3 -
 4
4 -
 5
5 -
 6
6 -
 7
7 -
 8
8 -
 9
9 -
 10
10 -
 11
11 -
 12
12 -
 13
13 -
 14
14 -
 15
15 -
16
-
17
-
18
-
19
-
20
-
21
-
22
-
23
-
24
-
25
-
26
-
27
-
28
-
29
-
30
-
31
-
32
-
33
-
34
-
35
-
36
-
37
-
38
-
39
-
40
-
41
-
42
-
43
-
44
-
45
-
46
-
47
-
48
-
49
-
50
-
51
-
52
-
53
-
54
-
55
-
56
-
57
-
58
-
59
-
60
-
61
-
62
-
63
-
64
-
65
-
66
-
67
-
68
-
69
-
70
-
71
-
72
-
73
-
74
-
75
-
76
-
77
-
78
-
79
-
80
-
81
-
82
-
83
-
84
-
85
-
86
-
87
-
88
-
89
-
90
-
91
-
92
-
93
-
94
-
95
-
96
 |
 |

2 SAFEWAY INC. 2005 ANNUAL REPORT
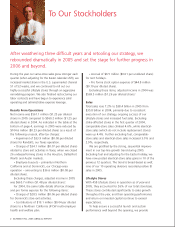
To Our Stockholders
During the year our same-store sales grew stronger each
quarter (when adjusting for the Easter calendar shift), we
increased market share in the U.S. supermarket channel
51 of 52 weeks, and we continued to roll out our
highly successful Lifestyle stores through an aggressive
remodeling program. We also finished restructuring our
labor contracts and have begun to experience solid
operating and administrative expense leverage.
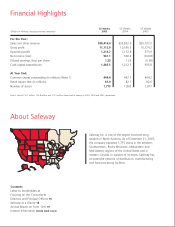
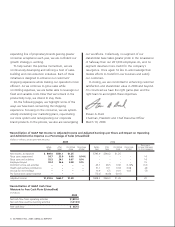
Results From Operations
Net income was $561.1 million ($1.25 per diluted
share) in 2005 compared to $560.2 million ($1.25 per
diluted share) in 2004. As indicated in the table at the
bottom of page 4, earnings in 2005 were reduced by
$104.6 million ($0.23 per diluted share) as a result of
the following unusual, after-tax charges:
•Impairment of $33.9 million ($0.08 per diluted
share) for Randall’s, our Texas operation.
•Charges of $34.1 million ($0.07 per diluted share)
related to store exit activities in Texas, when we closed
26 underperforming stores in the Houston, Dallas/Fort
Worth and Austin markets.
•Employee buyouts – primarily in Northern
California and at Dominick’s, our Chicago-area
operation – amounting to $36.6 million ($0.08 per
diluted share).
Excluding these charges, adjusted income in 2005
was $665.7 million ($1.48 per diluted share).1
For 2004, the same table details after-tax charges
and pro forma expense for the following items:
•Charges of $28.5 million ($0.06 per diluted share)
for Dominick’s store exit activities.
•Contributions of $19.1 million ($0.04 per diluted
share) to a Northern California UFCW multi-employer
health and welfare plan.
•Accrual of $6.5 million ($0.01 per undiluted share)
for rent holidays.
•Pro forma stock option expense of $44.8 million
($0.10 per diluted share).
Excluding these items, adjusted income in 2004 was
$569.5 million ($1.26 per diluted share).1
Sales
Total sales rose 7.2% to $38.4 billion in 2005 from
$35.8 billion in 2004, primarily due to consistent
execution of our strategy, ongoing success of our
Lifestyle stores and increased fuel sales. Excluding
strike-affected stores in the first quarter of 2004,
comparable-store sales climbed 4.6%, while identical-
store sales (which do not include replacement stores)
were up 4.4%. Further excluding fuel, comparable-
store sales and identical-store sales increased 3.0% and
2.9%, respectively.
We are gratified by the strong, sequential improve-
ment in our top-line growth trend during 2005.
Excluding fuel and adjusting for the Easter holiday, we
have now posted identical-store sales gains in 10 of the
previous 12 quarters. The trend is broad-based as well;
nine of our 10 operating divisions recorded positive ID
sales in 2005.
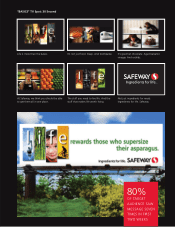
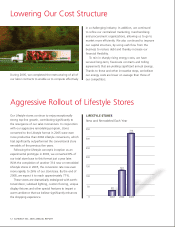
Lifestyle Stores
With 458 Lifestyle stores in operation as of year-end
2005, they accounted for 26% of our total store base.
These stores contributed significantly to sales growth
throughout the year, and their operating performance
and return on invested capital continue to exceed
expectations.
To help ensure a successful launch and sustain
performance well beyond the opening, we provide
After weathering three difficult years and retooling our strategy, we
rebounded dramatically in 2005 and set the stage for further progress in
2006 and beyond.