Safeway 2005 Annual Report Download - page 48
Download and view the complete annual report
Please find page 48 of the 2005 Safeway annual report below. You can navigate through the pages in the report by either clicking on the pages listed below, or by using the keyword search tool below to find specific information within the annual report.-
 1
1 -
2
-
3
-
4
-
5
-
6
-
7
-
8
-
9
-
10
-
11
-
12
-
13
-
14
-
15
-
16
-
17
-
18
-
19
-
20
-
21
-
22
-
23
-
24
-
25
-
26
-
27
-
28
-
29
-
30
-
31
-
32
-
33
-
34
-
35
-
36
-
37
-
 38
38 -
 39
39 -
 40
40 -
 41
41 -
 42
42 -
 43
43 -
 44
44 -
 45
45 -
 46
46 -
 47
47 -
 48
48 -
 49
49 -
 50
50 -
 51
51 -
 52
52 -
 53
53 -
 54
54 -
 55
55 -
 56
56 -
 57
57 -
 58
58 -
59
-
60
-
61
-
62
-
63
-
64
-
65
-
66
-
67
-
68
-
69
-
70
-
71
-
72
-
73
-
74
-
75
-
76
-
77
-
78
-
79
-
80
-
81
-
82
-
83
-
84
-
85
-
86
-
87
-
88
-
89
-
90
-
91
-
92
-
93
-
94
-
95
-
96
 |
 |

SAFEWAY INC. AND SUBSIDIARIES
28
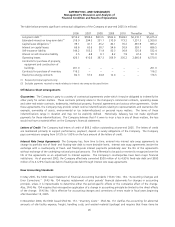
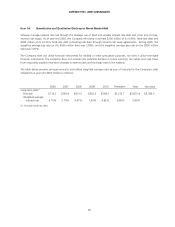
Item 7A. Quantitative and Qualitative Disclosures About Market Risk
Safeway manages interest rate risk through the strategic use of fixed and variable interest rate debt and, from time to time,
interest rate swaps. As of year-end 2005, the Company effectively converted $500 million of its 4.95% fixed-rate debt and
$300 million of its 4.125% fixed-rate debt to floating-rate debt through interest rate swap agreements. During 2005, the
weighted average pay rate on the $500 million debt was 3.99%, and the weighted average pay rate on the $300 million
debt was 3.87%.
The Company does not utilize financial instruments for trading or other speculative purposes, nor does it utilize leveraged
financial instruments. The Company does not consider the potential declines in future earnings, fair values and cash flows
from reasonably possible near-term changes in interest rates and exchange rates to be material.
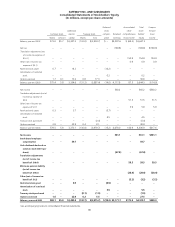
The table below presents principal amounts and related weighted average rates by year of maturity for the Company’s debt
obligations at year-end 2005 (dollars in millions):
2006 2007 2008 2009 2010 Thereafter Total Fair value
Long-term debt:(1)
Principal $714.2 $785.4 $813.5 $502.4 $549.2 $2,310.7 $5,675.4 $5,786.5
Weighted average
interest rate 6.15% 5.79% 4.97% 7.50% 4.82% 6.40% 5.99%
(1) Primarily fixed-rate debt