Safeway 2005 Annual Report Download - page 6
Download and view the complete annual report
Please find page 6 of the 2005 Safeway annual report below. You can navigate through the pages in the report by either clicking on the pages listed below, or by using the keyword search tool below to find specific information within the annual report.-
 1
1 -
 2
2 -
 3
3 -
 4
4 -
 5
5 -
 6
6 -
 7
7 -
 8
8 -
 9
9 -
 10
10 -
 11
11 -
 12
12 -
 13
13 -
 14
14 -
 15
15 -
 16
16 -
 17
17 -
18
-
19
-
20
-
21
-
22
-
23
-
24
-
25
-
26
-
27
-
28
-
29
-
30
-
31
-
32
-
33
-
34
-
35
-
36
-
37
-
38
-
39
-
40
-
41
-
42
-
43
-
44
-
45
-
46
-
47
-
48
-
49
-
50
-
51
-
52
-
53
-
54
-
55
-
56
-
57
-
58
-
59
-
60
-
61
-
62
-
63
-
64
-
65
-
66
-
67
-
68
-
69
-
70
-
71
-
72
-
73
-
74
-
75
-
76
-
77
-
78
-
79
-
80
-
81
-
82
-
83
-
84
-
85
-
86
-
87
-
88
-
89
-
90
-
91
-
92
-
93
-
94
-
95
-
96
 |
 |
4 SAFEWAY INC. 2005 ANNUAL REPORT
expanding line of proprietary brands gaining greater
consumer acceptance each year, we are confident our
growth strategy is working.
To help sustain this positive momentum, we are
continuously developing and refining a host of sales-
building and cost-reduction initiatives. Each of these
initiatives is designed to enhance our customers’
shopping experience while making our operations more
efficient. As we continue to grow sales while
controlling expenses, we are better able to leverage our
fixed and variable costs. Now that we’re back in the
productivity loop, we intend to stay there.
On the following pages, we highlight some of the
ways we have been reinventing the shopping
experience. Focusing on the consumer, we are system-
atically revitalizing our marketing plans, rejuvenating
our store system and reinvigorating our corporate
brand products. In the process, we also are reenergizing
our workforce. Collectively, no segment of our
stakeholder base takes greater pride in the renaissance
of Safeway than our 201,000 employees do, and no
segment deserves more credit for the company’s
resurgence. Once again I‘d like to acknowledge their
tireless efforts to transform our business and satisfy
our customers.
In closing, we are committed to enhancing customer
satisfaction and shareholder value in 2006 and beyond.
I’m convinced we have the right game plan and the
right team to accomplish these objectives.
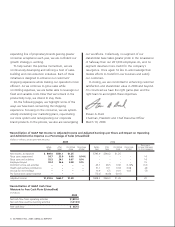
Steven A. Burd
Chairman, President and Chief Executive Officer
March 10, 2006
Reconciliation of GAAP Net Income to Adjusted Income and Adjusted Earnings per Share and Impact on Operating
and Administrative Expense as a Percentage of Sales (Unaudited)
(Dollars in millions, except per-share amounts)
2005 2004
Basis point
Before After Per diluted Percentage Before After Per diluted Percentage increase (decrease)
taxes taxes share of sales taxes taxes share of sales in O & A expense
Net income, as reported $ 849.0 $561.1 $1.25 $793.9 $560.2 $1.25
Texas store impairment 54.7 33.9 0.08 0.14% –––– 14
Texas store exit activities 55.5 34.1 0.07 0.14 – – – – 14
Employee buyout 59.4 36.6 0.08 0.15 – – – – 15
Dominick’s store exit activities –––– 45.7 28.5 0.06 0.12% (12)
Health and welfare contribution –––– 31.1 19.1 0.04 0.08 (8)
Accrual for rent holidays – – – – 10.6 6.5 0.01 0.03 (3)
Pro forma stock option expense ––– (73.0) (44.8) (0.10)
Adjusted income $1,018.6 $665.7 $1.48 $808.3 $569.5 $1.26 20
1
Reconciliation of GAAP Cash Flow
Measure to Free Cash Flow (Unaudited)
(In millions)
2005
Net cash flow from operating activities $1,881.0
Net cash flow used by investing activities (1,313.5)
Free cash flow $ 567.5
2