Safeway 2005 Annual Report Download - page 56
Download and view the complete annual report
Please find page 56 of the 2005 Safeway annual report below. You can navigate through the pages in the report by either clicking on the pages listed below, or by using the keyword search tool below to find specific information within the annual report.-
 1
1 -
2
-
3
-
4
-
5
-
6
-
7
-
8
-
9
-
10
-
11
-
12
-
13
-
14
-
15
-
16
-
17
-
18
-
19
-
20
-
21
-
22
-
23
-
24
-
25
-
26
-
27
-
28
-
29
-
30
-
31
-
32
-
33
-
34
-
35
-
36
-
37
-
38
-
39
-
40
-
41
-
42
-
43
-
44
-
45
-
 46
46 -
 47
47 -
 48
48 -
 49
49 -
 50
50 -
 51
51 -
 52
52 -
 53
53 -
 54
54 -
 55
55 -
 56
56 -
 57
57 -
 58
58 -
 59
59 -
 60
60 -
 61
61 -
 62
62 -
 63
63 -
 64
64 -
 65
65 -
 66
66 -
67
-
68
-
69
-
70
-
71
-
72
-
73
-
74
-
75
-
76
-
77
-
78
-
79
-
80
-
81
-
82
-
83
-
84
-
85
-
86
-
87
-
88
-
89
-
90
-
91
-
92
-
93
-
94
-
95
-
96
 |
 |

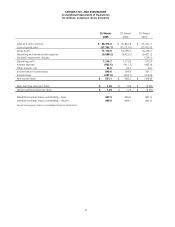
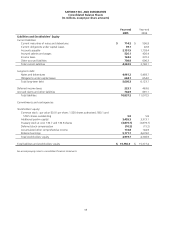
SAFEWAY INC. AND SUBSIDIARIES
Consolidated Statements of Cash Flows
(In millions)
36
52 Weeks
2005
52 Weeks
2004
53 Weeks
2003
Operating Activities:
Net income (loss) $ 561.1 $ 560.2 $ (169.8)
Reconciliation to net cash flow from operating activities:
Goodwill impairment charges −−729.1
Property impairment charges 78.9 39.4 344.9
Miscellaneous equity investment impairment charges −−10.6
Depreciation and amortization 932.7 894.6 863.6
Amortization of deferred finance costs 7.5 7.8 8.0
Deferred income taxes (215.9) (29.2) (77.9)
LIFO income (0.2) (15.2) (1.3)
Equity in (earnings) losses of unconsolidated affiliates (15.8) (12.6) 7.1
Net pension expense 115.6 112.9 130.9
Contributions to pension plans (18.1) (15.1) (12.1)
Employee stock option expense 59.7 −−
Other 6.9 6.7 0.2
Long-term accrued claims and other liabilities 44.1 118.1 52.7
Loss (gain) on property retirements 13.6 20.6 (13.4)
Changes in working capital items:
Receivables (10.3) 46.3 56.6
Inventories at FIFO cost (7.7) (61.9) 144.4
Prepaid expenses and other current assets 37.1 50.9 (72.8)
Income taxes (128.8) 218.1 21.5
Payables and accruals 420.6 284.8 (412.7)
Net cash flow from operating activities 1,881.0 2,226.4 1,609.6
Investing Activities:
Cash paid for property additions (1,383.5) (1,212.5) (935.8)
Proceeds from sale of property 105.1 194.7 189.0
Other (35.1) (52.5) (48.2)
Net cash used by investing activities (1,313.5) (1,070.3) (795.0)