Safeway 2005 Annual Report Download - page 40
Download and view the complete annual report
Please find page 40 of the 2005 Safeway annual report below. You can navigate through the pages in the report by either clicking on the pages listed below, or by using the keyword search tool below to find specific information within the annual report.-
 1
1 -
2
-
3
-
4
-
5
-
6
-
7
-
8
-
9
-
10
-
11
-
12
-
13
-
14
-
15
-
16
-
17
-
18
-
19
-
20
-
21
-
22
-
23
-
24
-
25
-
26
-
27
-
28
-
29
-
 30
30 -
 31
31 -
 32
32 -
 33
33 -
 34
34 -
 35
35 -
 36
36 -
 37
37 -
 38
38 -
 39
39 -
 40
40 -
 41
41 -
 42
42 -
 43
43 -
 44
44 -
 45
45 -
 46
46 -
 47
47 -
 48
48 -
 49
49 -
 50
50 -
51
-
52
-
53
-
54
-
55
-
56
-
57
-
58
-
59
-
60
-
61
-
62
-
63
-
64
-
65
-
66
-
67
-
68
-
69
-
70
-
71
-
72
-
73
-
74
-
75
-
76
-
77
-
78
-
79
-
80
-
81
-
82
-
83
-
84
-
85
-
86
-
87
-
88
-
89
-
90
-
91
-
92
-
93
-
94
-
95
-
96
 |
 |

SAFEWAY INC. AND SUBSIDIARIES
Management’s Discussion and Analysis of
Financial Condition and Results of Operations
20
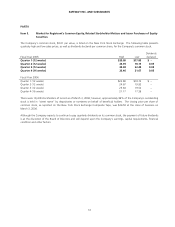
Safeway wrote off miscellaneous equity investments in 2003 totaling $10.6 million ($0.01 per diluted share), after
determining they were impaired. Safeway also incurred pre-tax charges totaling $25.5 million ($0.04 per diluted share) for
employee buyouts, severance costs and other costs related to the restructuring of the Company’s administrative offices.
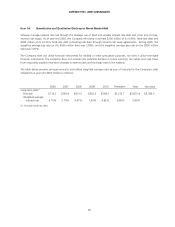
Sales Total sales increased 7.2% to $38.4 billion in 2005 from $35.8 billion in 2004, primarily because of Safeway’s
marketing strategy, Lifestyle store execution and increased fuel sales.
Same-store sales increases for 2005 were as follows:
Comparable-store sales
(includes replacement
stores)
Identical-store sales
(excludes replacement
stores)
Including fuel:
Excluding strike-affected stores 4.6% 4.4%
Including strike-affected stores 5.9% 5.8%
Excluding fuel:
Excluding strike-affected stores 3.0% 2.9%
Including strike-affected stores 4.4% 4.3%
In 2004, total sales increased only slightly to $35.8 billion from $35.7 billion in 2003, primarily because of the Southern
California strike and because fiscal 2004 had one fewer week than fiscal 2003.
Same-store sales increases (decreases) for 2004 were as follows:
Comparable-store sales
(includes replacement
stores)
Identical-store sales
(excludes replacement
stores)
Including fuel:
Excluding strike-affected stores 1.5% 0.9%
Including strike-affected stores 0.9% 0.3%
Excluding fuel:
Excluding strike-affected stores (0.2%) (0.8%)
Including strike-affected stores (0.7%) (1.3%)
In 2003, total sales increased 2.3% to $35.7 billion from $34.9 billion in 2002 primarily due to fiscal 2003 consisting of 53
weeks compared to 52 weeks in 2002, new store openings and additional fuel sales, partially offset by the estimated impact
of the strike in Southern California. Excluding the estimated effects of the strike in Southern California, comparable-store
sales were flat, while identical-store sales declined 0.4%. Further excluding the effects of fuel sales, 2003 comparable-store
sales decreased 1.6% and identical-store sales decreased 2.0%.
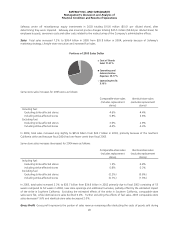
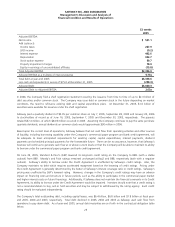
Gross Profit Gross profit represents the portion of sales revenue remaining after deducting the costs of goods sold during
Portions of 2005 Sales Dollar
Cost of Goods
Sold: 71.07%
Operating and
Administrative
Expense: 25.77%
Operating Profit:
3.16%