Safeway 2005 Annual Report Download - page 54
Download and view the complete annual report
Please find page 54 of the 2005 Safeway annual report below. You can navigate through the pages in the report by either clicking on the pages listed below, or by using the keyword search tool below to find specific information within the annual report.-
 1
1 -
2
-
3
-
4
-
5
-
6
-
7
-
8
-
9
-
10
-
11
-
12
-
13
-
14
-
15
-
16
-
17
-
18
-
19
-
20
-
21
-
22
-
23
-
24
-
25
-
26
-
27
-
28
-
29
-
30
-
31
-
32
-
33
-
34
-
35
-
36
-
37
-
38
-
39
-
40
-
41
-
42
-
43
-
 44
44 -
 45
45 -
 46
46 -
 47
47 -
 48
48 -
 49
49 -
 50
50 -
 51
51 -
 52
52 -
 53
53 -
 54
54 -
 55
55 -
 56
56 -
 57
57 -
 58
58 -
 59
59 -
 60
60 -
 61
61 -
 62
62 -
 63
63 -
 64
64 -
65
-
66
-
67
-
68
-
69
-
70
-
71
-
72
-
73
-
74
-
75
-
76
-
77
-
78
-
79
-
80
-
81
-
82
-
83
-
84
-
85
-
86
-
87
-
88
-
89
-
90
-
91
-
92
-
93
-
94
-
95
-
96
 |
 |

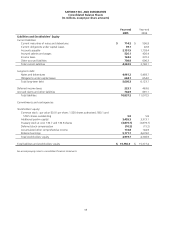
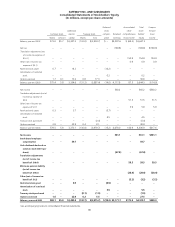
SAFEWAY INC. AND SUBSIDIARIES
Consolidated Balance Sheets
(In millions, except per-share amounts)
34
Year-end
2005
Year-end
2004
Assets
Current assets:
Cash and equivalents $ 373.3 $ 266.8
Receivables 350.6 339.0
Merchandise inventories, net of LIFO reserve of $48.4 and $48.6 2,766.0 2,740.7
Prepaid expenses and other current assets 212.5 251.2
Total current assets 3,702.4 3,597.7
Property:
Land 1,413.9 1,396.0
Buildings 4,419.1 4,269.7
Leasehold improvements 2,958.0 2,621.9
Fixtures and equipment 6,558.7 5,981.3
Property under capital leases 779.1 773.8
16,128.8 15,042.7
Less accumulated depreciation and amortization (7,031.7) (6,353.3)
Total property, net 9,097.1 8,689.4
Goodwill 2,402.4 2,406.6
Prepaid pension costs 179.4 321.0
Investments in unconsolidated affiliates 201.8 187.6
Other assets 173.8 175.1
Total assets $ 15,756.9 $ 15,377.4