Porsche 2005 Annual Report Download - page 136
Download and view the complete annual report
Please find page 136 of the 2005 Porsche annual report below. You can navigate through the pages in the report by either clicking on the pages listed below, or by using the keyword search tool below to find specific information within the annual report.-
 1
1 -
2
-
3
-
4
-
5
-
6
-
7
-
8
-
9
-
10
-
11
-
12
-
13
-
14
-
15
-
16
-
17
-
18
-
19
-
20
-
21
-
22
-
23
-
24
-
25
-
26
-
27
-
28
-
29
-
30
-
31
-
32
-
33
-
34
-
35
-
36
-
37
-
38
-
39
-
40
-
41
-
42
-
43
-
44
-
45
-
46
-
47
-
48
-
49
-
50
-
51
-
52
-
53
-
54
-
55
-
56
-
57
-
58
-
59
-
60
-
61
-
62
-
63
-
64
-
65
-
66
-
67
-
68
-
69
-
70
-
71
-
72
-
73
-
74
-
75
-
76
-
77
-
78
-
79
-
80
-
81
-
82
-
83
-
84
-
85
-
86
-
87
-
88
-
89
-
90
-
91
-
92
-
93
-
94
-
95
-
96
-
97
-
98
-
99
-
100
-
101
-
102
-
103
-
104
-
105
-
106
-
107
-
108
-
109
-
110
-
111
-
112
-
113
-
114
-
115
-
116
-
117
-
118
-
119
-
120
-
121
-
122
-
123
-
124
-
125
-
 126
126 -
 127
127 -
 128
128 -
 129
129 -
 130
130 -
 131
131 -
 132
132 -
 133
133 -
 134
134 -
 135
135 -
 136
136 -
 137
137 -
 138
138 -
 139
139 -
 140
140 -
 141
141 -
 142
142 -
 143
143 -
 144
144 -
 145
145 -
 146
146 -
147
-
148
-
149
-
150
-
151
-
152
-
153
-
154
-
155
-
156
-
157
-
158
-
159
-
160
-
161
-
162
-
163
-
164
-
165
-
166
 |
 |

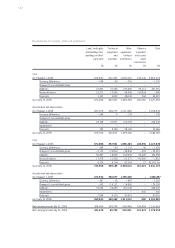
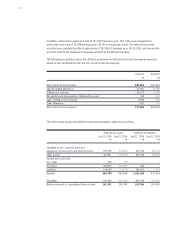
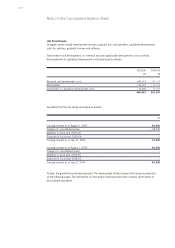
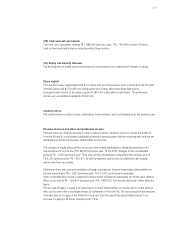
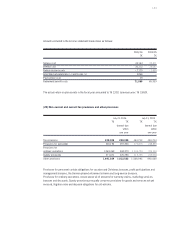
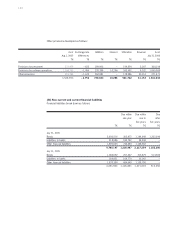
134
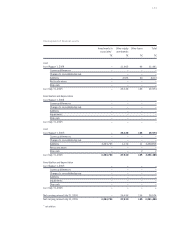
Leased assets Total fixed
assets
T€ T€
Cost
As of August 1, 2004 1,290,677 4,699,721
Currency differences – 3,741 – 5,527
Changes to consolidated group ––
Additions 543,638 918,977
Reclassifications ––
Disposals 472,750 536,474
As of July 31, 2005 1,357,824 5,076,697
Amortization and depreciation
As of August 1, 2004 368,244 2,319,622
Currency differences – 1,234 – 2,399
Changes to consolidated group ––
Additions 174,613 518,242
Impairments – –
Disposals 150,906 187,118
As of July 31, 2005 390,717 2,648,347
Cost
As of August 1, 2005 1,357,824 5,076,697
Currency differences – 56,484 – 58,434
Changes to consolidated group – – 131,861
Additions 551,948 4,224,238
Reclassifications ––
Disposals 533,097 597,078
As of July 31, 2006 1,320,191 8,513,562
Amortization and depreciation
As of August 1, 2005 390,717 2,648,347
Currency differences – 15,166 – 16,686
Changes to consolidated group – – 61,885
Additions 164,801 486,434
Impairments – 1,579
Disposals 180,811 225,012
As of July 31, 2006 359,541 2,832,777
Net carrying amount July 31, 2005 967,107 2,428,350
Net carrying amount July 31, 2006 960,650 5,680,785
Development of leased assets and of total fixed assets