Porsche 2005 Annual Report Download - page 125
Download and view the complete annual report
Please find page 125 of the 2005 Porsche annual report below. You can navigate through the pages in the report by either clicking on the pages listed below, or by using the keyword search tool below to find specific information within the annual report.-
 1
1 -
2
-
3
-
4
-
5
-
6
-
7
-
8
-
9
-
10
-
11
-
12
-
13
-
14
-
15
-
16
-
17
-
18
-
19
-
20
-
21
-
22
-
23
-
24
-
25
-
26
-
27
-
28
-
29
-
30
-
31
-
32
-
33
-
34
-
35
-
36
-
37
-
38
-
39
-
40
-
41
-
42
-
43
-
44
-
45
-
46
-
47
-
48
-
49
-
50
-
51
-
52
-
53
-
54
-
55
-
56
-
57
-
58
-
59
-
60
-
61
-
62
-
63
-
64
-
65
-
66
-
67
-
68
-
69
-
70
-
71
-
72
-
73
-
74
-
75
-
76
-
77
-
78
-
79
-
80
-
81
-
82
-
83
-
84
-
85
-
86
-
87
-
88
-
89
-
90
-
91
-
92
-
93
-
94
-
95
-
96
-
97
-
98
-
99
-
100
-
101
-
102
-
103
-
104
-
105
-
106
-
107
-
108
-
109
-
110
-
111
-
112
-
113
-
114
-
 115
115 -
 116
116 -
 117
117 -
 118
118 -
 119
119 -
 120
120 -
 121
121 -
 122
122 -
 123
123 -
 124
124 -
 125
125 -
 126
126 -
 127
127 -
 128
128 -
 129
129 -
 130
130 -
 131
131 -
 132
132 -
 133
133 -
 134
134 -
 135
135 -
136
-
137
-
138
-
139
-
140
-
141
-
142
-
143
-
144
-
145
-
146
-
147
-
148
-
149
-
150
-
151
-
152
-
153
-
154
-
155
-
156
-
157
-
158
-
159
-
160
-
161
-
162
-
163
-
164
-
165
-
166
 |
 |

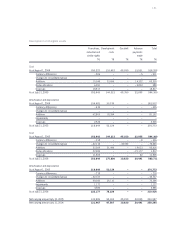
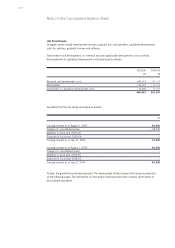
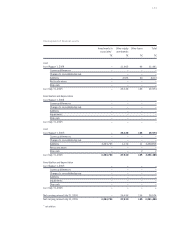
131
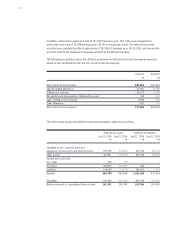
Franchises, Development Goodwill Advance Total
industrial and costs payments
similar rights made
T€ T€ T€ T€ T€
Cost
As of August 1, 2004 350,227 110,657 45,350 13,531 519,765
Currency differences – 506 – – – 5 – 511
Changes to consolidated group – – – – –
Additions 15,348 33,655 – 14,332 63,335
Reclassifications 6,391 – – – 5,803 588
Disposals 18,817 – – – 18,817
As of July 31, 2005 352,643 144,312 45,350 22,055 564,360
Amortization and depreciation
As of August 1, 2004 158,802 33,735 – – 192,537
Currency differences – 435 – – – – 435
Changes to consolidated group – – – – –
Additions 62,803 18,394 – – 81,197
Impairments – – – – –
Disposals 2,526 – – – 2,526
As of July 31, 2005 218,644 52,129 – – 270,773
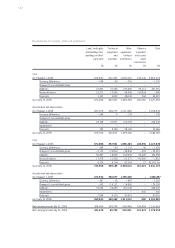
Cost
As of August 1, 2005 352,643 144,312 45,350 22,055 564,360
Currency differences – 318 – – – 8 – 326
Changes to consolidated group – 42,116 – – 34,530 – – 76,646
Additions 32,309 31,494 – 19,613 83,416
Reclassifications 22,989 – – – 21,177 1,812
Disposals 11,863 – – 42 11,905
As of July 31, 2006 353,644 175,806 10,820 20,441 560,711
Amortization and depreciation
As of August 1, 2005 218,644 52,129 – – 270,773
Currency differences – 218 – – – – 218
Changes to consolidated group – 32,727 – – – – 32,727
Additions 49,286 26,110 – – 75,396
Impairments 1,177 – – – 1,177
Disposals 3,985 – – – 3,985
As of July 31, 2006 232,177 78,239 – – 310,416
Net carrying amount July 31, 2005 133,999 92,183 45,350 22,055 293,587
Net carrying amount July 31, 2006 121,467 97,567 10,820 20,441 250,295
Development of intangible assets