Porsche 2005 Annual Report Download - page 111
Download and view the complete annual report
Please find page 111 of the 2005 Porsche annual report below. You can navigate through the pages in the report by either clicking on the pages listed below, or by using the keyword search tool below to find specific information within the annual report.-
 1
1 -
2
-
3
-
4
-
5
-
6
-
7
-
8
-
9
-
10
-
11
-
12
-
13
-
14
-
15
-
16
-
17
-
18
-
19
-
20
-
21
-
22
-
23
-
24
-
25
-
26
-
27
-
28
-
29
-
30
-
31
-
32
-
33
-
34
-
35
-
36
-
37
-
38
-
39
-
40
-
41
-
42
-
43
-
44
-
45
-
46
-
47
-
48
-
49
-
50
-
51
-
52
-
53
-
54
-
55
-
56
-
57
-
58
-
59
-
60
-
61
-
62
-
63
-
64
-
65
-
66
-
67
-
68
-
69
-
70
-
71
-
72
-
73
-
74
-
75
-
76
-
77
-
78
-
79
-
80
-
81
-
82
-
83
-
84
-
85
-
86
-
87
-
88
-
89
-
90
-
91
-
92
-
93
-
94
-
95
-
96
-
97
-
98
-
99
-
100
-
 101
101 -
 102
102 -
 103
103 -
 104
104 -
 105
105 -
 106
106 -
 107
107 -
 108
108 -
 109
109 -
 110
110 -
 111
111 -
 112
112 -
 113
113 -
 114
114 -
 115
115 -
 116
116 -
 117
117 -
 118
118 -
 119
119 -
 120
120 -
 121
121 -
122
-
123
-
124
-
125
-
126
-
127
-
128
-
129
-
130
-
131
-
132
-
133
-
134
-
135
-
136
-
137
-
138
-
139
-
140
-
141
-
142
-
143
-
144
-
145
-
146
-
147
-
148
-
149
-
150
-
151
-
152
-
153
-
154
-
155
-
156
-
157
-
158
-
159
-
160
-
161
-
162
-
163
-
164
-
165
-
166
 |
 |

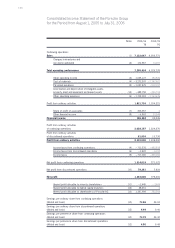
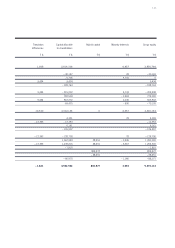
109
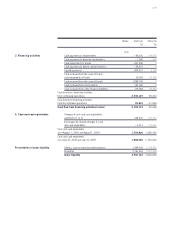
Notes 2005/06 2004/05
T€ T€
(13)
Cash payments to shareholders – 86,975 – 69,475
Cash payments to minority shareholders – 1,096 – 630
Cash repayments of bonds – 257,446 0
Cash payments to hybrid capital investors – 28,451 0
Capital payments 809,977 5,706
Cash received from the issue of loans/
cash repayments of loans 19,185 67,568
Cash received from the issue of bonds 1,884,740 0
Cash received from stock options 187,090 0
Cash received from other financial liabilities 179,083 92,063
Cash flow from financing activities
from continuing operations 2,706,107 95,232
Cash flow from financing activities
from discontinued operations 22,612 – 11,606
Cash flow from financing activities in total 2,728,719 83,626
Changes in cash and cash equivalents
(subtotal of 1 to 3) 238,631 327,747
Exchange-rate related changes in cash
and cash equivalents – 5,011 – 31,607
Cash and cash equivalents
as of August 1, 2005 and August 1, 2004 1,754,930 1,458,790
Cash and cash equivalents
as of July 31, 2006 and July 31, 2005 1,988,550 1,754,930
Checks, cash on hand and bank balances 1,988,550 1,754,930
Securities 2,761,593 1,871,096
Gross liquidity 4,750,143 3,626,026
3. Financing activities
4. Cash and cash equivalents
Presentation of gross liquidity