Porsche 2005 Annual Report Download - page 126
Download and view the complete annual report
Please find page 126 of the 2005 Porsche annual report below. You can navigate through the pages in the report by either clicking on the pages listed below, or by using the keyword search tool below to find specific information within the annual report.-
 1
1 -
2
-
3
-
4
-
5
-
6
-
7
-
8
-
9
-
10
-
11
-
12
-
13
-
14
-
15
-
16
-
17
-
18
-
19
-
20
-
21
-
22
-
23
-
24
-
25
-
26
-
27
-
28
-
29
-
30
-
31
-
32
-
33
-
34
-
35
-
36
-
37
-
38
-
39
-
40
-
41
-
42
-
43
-
44
-
45
-
46
-
47
-
48
-
49
-
50
-
51
-
52
-
53
-
54
-
55
-
56
-
57
-
58
-
59
-
60
-
61
-
62
-
63
-
64
-
65
-
66
-
67
-
68
-
69
-
70
-
71
-
72
-
73
-
74
-
75
-
76
-
77
-
78
-
79
-
80
-
81
-
82
-
83
-
84
-
85
-
86
-
87
-
88
-
89
-
90
-
91
-
92
-
93
-
94
-
95
-
96
-
97
-
98
-
99
-
100
-
101
-
102
-
103
-
104
-
105
-
106
-
107
-
108
-
109
-
110
-
111
-
112
-
113
-
114
-
115
-
 116
116 -
 117
117 -
 118
118 -
 119
119 -
 120
120 -
 121
121 -
 122
122 -
 123
123 -
 124
124 -
 125
125 -
 126
126 -
 127
127 -
 128
128 -
 129
129 -
 130
130 -
 131
131 -
 132
132 -
 133
133 -
 134
134 -
 135
135 -
 136
136 -
137
-
138
-
139
-
140
-
141
-
142
-
143
-
144
-
145
-
146
-
147
-
148
-
149
-
150
-
151
-
152
-
153
-
154
-
155
-
156
-
157
-
158
-
159
-
160
-
161
-
162
-
163
-
164
-
165
-
166
 |
 |

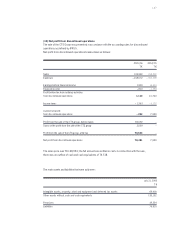
132
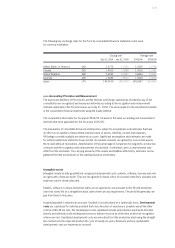
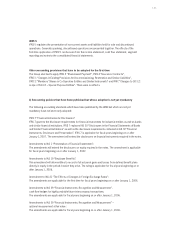
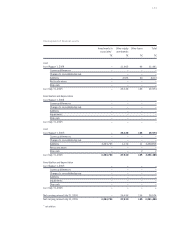
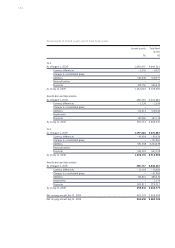
Land, land rights Technical Other Advance Total
and buildings incl. equipment equipment, payments
buildings on third- and furniture and assets
party land machines and fixtures under
construction
T€ T€ T€ T€ T€
Cost
As of August 1,2004 632,881 421,487 1,676,810 136,140 2,867,318
Currency differences – 934 – 85 – 256 – – 1,275
Changes to consolidated group – – – – –
Additions 27,847 31,065 193,365 55,114 307,391
Reclassifications 15,211 10,556 64,499 – 90,854 – 588
Disposals 1,107 5,422 38,034 344 44,907
As of July 31, 2005 673,898 457,601 1,896,384 100,056 3,127,939
Amortization and depreciation
As of August 1, 2004 257,076 329,777 1,171,988 – 1,758,841
Currency differences – 546 – 5 – 179 – – 730
Changes to consolidated group – – – – –
Additions 18,769 27,871 215,792 – 262,432
Impairments – ––––
Disposals 755 4,766 28,165 – 33,686
As of July 31, 2005 274,544 352,877 1,359,436 – 1,986,857
Cost
As of August 1, 2005 673,898 457,601 1,896,384 100,056 3,127,939
Currency differences – 488 – 44 – 1,137 45 – 1,624
Changes to consolidated group – 2,175 – 23,854 – 28,894 – 292 – 55,215
Additions 50,827 18,249 160,654 94,228 323,958
Reclassifications 17,575 11,938 61,271 – 92,596 – 1,812
Disposals 5,079 4,704 42,264 27 52,074 As
As of July 31, 2006 734,558 459,186 2,046,014 101,414 3,341,172
Amortization and depreciation
As of August 1, 2005 274,544 352,877 1,359,436 – 1,986,857
Currency differences – 387 – 28 – 887 – – 1,302
Changes to consolidated group – 162 – 14,131 – 14,865 – – 29,158
Additions 19,034 26,459 200,744 – 246,237
Impairments – – – 402 402
Disposals 2,086 4,715 33,415 – 40,216
As of July 31, 2006 290,943 360,462 1,511,013 402 2,162,820
Net carrying amount July 31, 2005 399,354 104,724 536,948 100,056 1,141,082
Net carrying amount July 31, 2006 443,615 98,724 535,001 101,012 1,178,352
Development of property, plant and equipment