Neiman Marcus 2013 Annual Report Download - page 40
Download and view the complete annual report
Please find page 40 of the 2013 Neiman Marcus annual report below. You can navigate through the pages in the report by either clicking on the pages listed below, or by using the keyword search tool below to find specific information within the annual report.-
 1
1 -
2
-
3
-
4
-
5
-
6
-
7
-
8
-
9
-
10
-
11
-
12
-
13
-
14
-
15
-
16
-
17
-
18
-
19
-
20
-
21
-
22
-
23
-
24
-
25
-
26
-
27
-
28
-
29
-
 30
30 -
 31
31 -
 32
32 -
 33
33 -
 34
34 -
 35
35 -
 36
36 -
 37
37 -
 38
38 -
 39
39 -
 40
40 -
 41
41 -
 42
42 -
 43
43 -
 44
44 -
 45
45 -
 46
46 -
 47
47 -
 48
48 -
 49
49 -
 50
50 -
51
-
52
-
53
-
54
-
55
-
56
-
57
-
58
-
59
-
60
-
61
-
62
-
63
-
64
-
65
-
66
-
67
-
68
-
69
-
70
-
71
-
72
-
73
-
74
-
75
-
76
-
77
-
78
-
79
-
80
-
81
-
82
-
83
-
84
-
85
-
86
-
87
-
88
-
89
-
90
-
91
-
92
-
93
-
94
-
95
-
96
-
97
-
98
-
99
-
100
-
101
-
102
-
103
-
104
-
105
-
106
-
107
-
108
-
109
-
110
-
111
-
112
-
113
-
114
-
115
-
116
-
117
-
118
-
119
-
120
-
121
-
122
-
123
-
124
-
125
-
126
-
127
-
128
-
129
-
130
-
131
-
132
-
133
-
134
-
135
-
136
-
137
-
138
-
139
-
140
-
141
-
142
-
143
-
144
-
145
-
146
-
147
-
148
-
149
-
150
-
151
-
152
-
153
-
154
-
155
-
156
-
157
-
158
-
159
-
160
-
161
-
162
-
163
-
164
-
165
-
166
-
167
-
168
-
169
-
170
-
171
-
172
-
173
-
174
-
175
-
176
-
177
-
178
-
179
-
180
-
181
-
182
-
183
-
184
-
185
-
186
-
187
-
188
-
189
-
190
-
191
-
192
-
193
-
194
-
195
-
196
-
197
-
198
-
199
-
200
-
201
-
202
-
203
 |
 |

Table of Contents
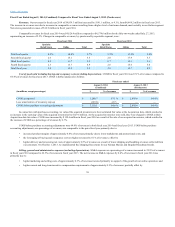
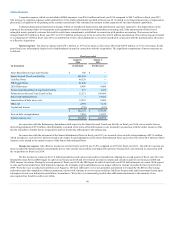
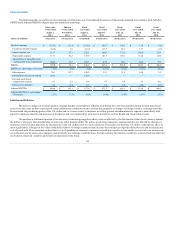
Revenues. Our revenues for fiscal year 2014 of $4,839.3 million increased by $191.1 million, or 4.1%, from $4,648.2 million in fiscal year 2013.
The increase in revenues was due to increases in comparable revenues resulting from a higher level of customer demand, most notably in our Online segment.
New stores generated revenues of $12.9 million in fiscal year 2014.
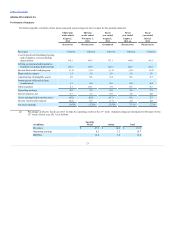
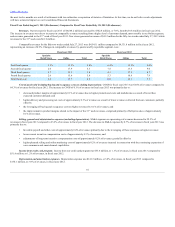
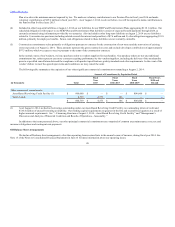
Comparable revenues for fiscal year 2014 were $4,826.4 million compared to $4,574.6 million for the fifty-two weeks ended July 27, 2013,
representing an increase of 5.5%. Changes in comparable revenues, by quarter and by reportable segment, were:
First fiscal quarter 4.5%
10.4%
5.7%
3.5%
13.5%
5.4%
Second fiscal quarter 2.6
15.1
5.5
2.0
17.9
5.3
Third fiscal quarter 4.2
11.7
5.9
0.7
15.1
3.6
Fourth fiscal quarter 2.3
13.7
4.9
2.6
15.6
5.4
Total fiscal year 3.4
12.9
5.5
2.2
15.7
4.9
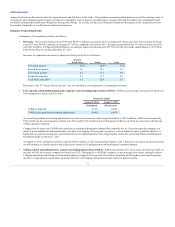
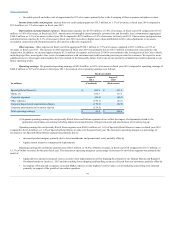
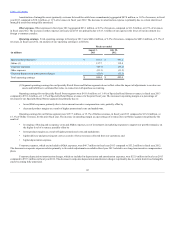
Cost of goods sold including buying and occupancy costs (excluding depreciation). COGS for fiscal year 2014 was 67.1% of revenues compared to
64.4% of revenues for fiscal year 2013. COGS is further analyzed as follows:
COGS, as reported
$ 3,248.7
67.1 %
$ 2,995.4
64.4%
Less: amortization of inventory step-up
(129.6)
(2.7)
—
—
COGS, before purchase accounting adjustments
$ 3,119.1
64.4 %
$ 2,995.4
64.4%
In connection with purchase accounting, we valued the acquired inventories to their estimated fair value at the Acquisition date, which resulted in
an increase in the carrying value of the acquired inventories by $129.6 million. As the acquired inventories were sold, they were charged to COGS at their
Acquisition date fair values. COGS were increased by $129.6 million in fiscal year 2014 as a result of the sale of our acquired inventories, which resulted in
the increase of COGS as a percentage of revenues by 2.7%.
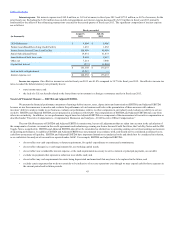
COGS before purchase accounting adjustments were 64.4% of revenues in both fiscal year 2014 and fiscal year 2013. COGS before purchase
accounting adjustments, as a percentage of revenues, was comparable to the prior fiscal year primarily due to:
• increased product margins of approximately 0.4% of revenues primarily due to lower markdowns and promotional costs; and
• the leveraging of buying and occupancy costs on higher revenues by 0.1% of revenues; offset by
• higher delivery and processing net costs of approximately 0.5% of revenues as a result of lower shipping and handling revenues collected from
our customers. On October 1, 2013, we implemented free shipping/free returns for our Neiman Marcus and Bergdorf Goodman brands.
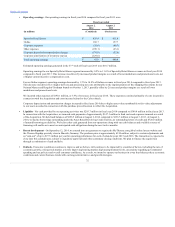
Selling, general and administrative expenses (excluding depreciation). SG&A expenses as a percentage of revenues increased to 22.9% of revenues
in fiscal year 2014 compared to 22.5% of revenues in fiscal year 2013. The net increase in SG&A expenses by 0.4% of revenues in fiscal year 2014 was
primarily due to:
• higher marketing and selling costs of approximately 0.3% of revenues incurred primarily in support of the growth of our online operation; and
• higher current and long-term incentive compensation requirements of approximately 0.2% of revenues; partially offset by
38