Neiman Marcus 2013 Annual Report Download - page 114
Download and view the complete annual report
Please find page 114 of the 2013 Neiman Marcus annual report below. You can navigate through the pages in the report by either clicking on the pages listed below, or by using the keyword search tool below to find specific information within the annual report.-
 1
1 -
2
-
3
-
4
-
5
-
6
-
7
-
8
-
9
-
10
-
11
-
12
-
13
-
14
-
15
-
16
-
17
-
18
-
19
-
20
-
21
-
22
-
23
-
24
-
25
-
26
-
27
-
28
-
29
-
30
-
31
-
32
-
33
-
34
-
35
-
36
-
37
-
38
-
39
-
40
-
41
-
42
-
43
-
44
-
45
-
46
-
47
-
48
-
49
-
50
-
51
-
52
-
53
-
54
-
55
-
56
-
57
-
58
-
59
-
60
-
61
-
62
-
63
-
64
-
65
-
66
-
67
-
68
-
69
-
70
-
71
-
72
-
73
-
74
-
75
-
76
-
77
-
78
-
79
-
80
-
81
-
82
-
83
-
84
-
85
-
86
-
87
-
88
-
89
-
90
-
91
-
92
-
93
-
94
-
95
-
96
-
97
-
98
-
99
-
100
-
101
-
102
-
103
-
 104
104 -
 105
105 -
 106
106 -
 107
107 -
 108
108 -
 109
109 -
 110
110 -
 111
111 -
 112
112 -
 113
113 -
 114
114 -
 115
115 -
 116
116 -
 117
117 -
 118
118 -
 119
119 -
 120
120 -
 121
121 -
 122
122 -
 123
123 -
 124
124 -
125
-
126
-
127
-
128
-
129
-
130
-
131
-
132
-
133
-
134
-
135
-
136
-
137
-
138
-
139
-
140
-
141
-
142
-
143
-
144
-
145
-
146
-
147
-
148
-
149
-
150
-
151
-
152
-
153
-
154
-
155
-
156
-
157
-
158
-
159
-
160
-
161
-
162
-
163
-
164
-
165
-
166
-
167
-
168
-
169
-
170
-
171
-
172
-
173
-
174
-
175
-
176
-
177
-
178
-
179
-
180
-
181
-
182
-
183
-
184
-
185
-
186
-
187
-
188
-
189
-
190
-
191
-
192
-
193
-
194
-
195
-
196
-
197
-
198
-
199
-
200
-
201
-
202
-
203
 |
 |

Table of Contents
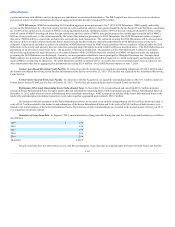
• Level 1 — Unadjusted quoted prices for identical instruments traded in active markets.
• Level 2 — Observable market-based inputs or unobservable inputs corroborated by market data.
• Level 3 — Unobservable inputs reflecting management’s estimates and assumptions.
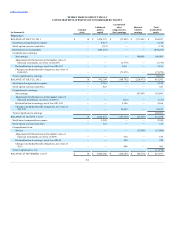
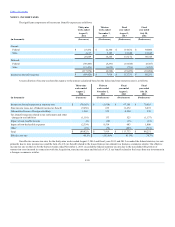
The following table shows the Company’s financial assets that are required to be measured at fair value on a recurring basis in our Consolidated
Balance Sheets:
Other long-term assets:
Interest rate caps
Level 2
$ 1,132
$ 29
The fair value of the interest rate caps are estimated using industry standard valuation models using market-based observable inputs, including
interest rate curves. In addition, the fair value of the interest rate caps includes consideration of the counterparty’s non-performance risk.
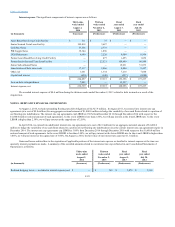
The carrying values of cash and cash equivalents, credit card receivables and accounts payable approximate fair value due to their short-term nature.
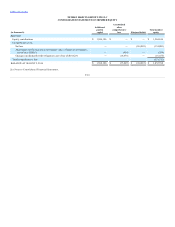
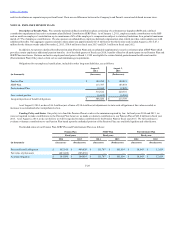
We determine the fair value of our long-term debt on a non-recurring basis, which results are summarized as follows:
Long-term debt:
Senior Secured Term Loan Facility
Level 2
$ 2,927,912
$ 2,907,797
$ —
$ —
Cash Pay Notes
Level 2
960,000
994,800
—
—
PIK Toggle Notes
Level 2
600,000
633,000
—
—
2028 Debentures
Level 2
122,035
127,500
122,077
125,625
Former Asset-Based Revolving Credit Facility
Level 2
—
—
15,000
15,000
Former Senior Secured Term Loan Facility
Level 2
—
—
2,560,000
2,566,400
We estimated the fair value of long-term debt using prevailing market rates for debt of similar remaining maturities and credit risk for our revolving
and term loan facilities and quoted market prices of the same or similar issues for the Cash Pay Notes, the PIK Toggle Notes and the $125.0 million aggregate
principal amount of 7.125% Debentures due 2028 (the 2028 Debentures and, together with the Cash Pay Notes and the PIK Toggle Notes, the Notes).
In connection with purchase accounting, we have made estimates of the fair value of our long-lived and intangible assets based upon assumptions
related to the future cash flows, discount rates and asset lives utilizing currently available information, and in some cases, valuation results from independent
valuation specialists (Level 3 determination of fair value). We also measure certain non-financial assets at fair value on a non-recurring basis, primarily long-
lived assets, intangible assets and goodwill, in connection with our periodic evaluations of such assets for potential impairment.
The significant components of our property and equipment, net are as follows:
Land, buildings and improvements $ 1,047,556
$ 1,017,463
Fixtures and equipment 373,033
904,879
Construction in progress 83,395
49,648
1,503,984
1,971,990
Less: accumulated depreciation and amortization 113,718
1,070,146
Property and equipment, net $ 1,390,266
$ 901,844
F-18