Neiman Marcus 2013 Annual Report Download - page 113
Download and view the complete annual report
Please find page 113 of the 2013 Neiman Marcus annual report below. You can navigate through the pages in the report by either clicking on the pages listed below, or by using the keyword search tool below to find specific information within the annual report.-
 1
1 -
2
-
3
-
4
-
5
-
6
-
7
-
8
-
9
-
10
-
11
-
12
-
13
-
14
-
15
-
16
-
17
-
18
-
19
-
20
-
21
-
22
-
23
-
24
-
25
-
26
-
27
-
28
-
29
-
30
-
31
-
32
-
33
-
34
-
35
-
36
-
37
-
38
-
39
-
40
-
41
-
42
-
43
-
44
-
45
-
46
-
47
-
48
-
49
-
50
-
51
-
52
-
53
-
54
-
55
-
56
-
57
-
58
-
59
-
60
-
61
-
62
-
63
-
64
-
65
-
66
-
67
-
68
-
69
-
70
-
71
-
72
-
73
-
74
-
75
-
76
-
77
-
78
-
79
-
80
-
81
-
82
-
83
-
84
-
85
-
86
-
87
-
88
-
89
-
90
-
91
-
92
-
93
-
94
-
95
-
96
-
97
-
98
-
99
-
100
-
101
-
102
-
 103
103 -
 104
104 -
 105
105 -
 106
106 -
 107
107 -
 108
108 -
 109
109 -
 110
110 -
 111
111 -
 112
112 -
 113
113 -
 114
114 -
 115
115 -
 116
116 -
 117
117 -
 118
118 -
 119
119 -
 120
120 -
 121
121 -
 122
122 -
 123
123 -
124
-
125
-
126
-
127
-
128
-
129
-
130
-
131
-
132
-
133
-
134
-
135
-
136
-
137
-
138
-
139
-
140
-
141
-
142
-
143
-
144
-
145
-
146
-
147
-
148
-
149
-
150
-
151
-
152
-
153
-
154
-
155
-
156
-
157
-
158
-
159
-
160
-
161
-
162
-
163
-
164
-
165
-
166
-
167
-
168
-
169
-
170
-
171
-
172
-
173
-
174
-
175
-
176
-
177
-
178
-
179
-
180
-
181
-
182
-
183
-
184
-
185
-
186
-
187
-
188
-
189
-
190
-
191
-
192
-
193
-
194
-
195
-
196
-
197
-
198
-
199
-
200
-
201
-
202
-
203
 |
 |

Table of Contents
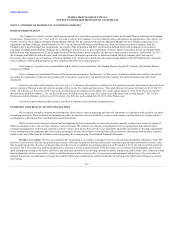
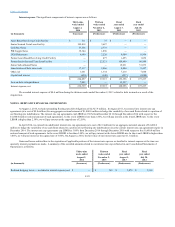
The purchase price has been allocated as follows (in millions):
Consideration payable to former equity holders (including $26.8 million management rollover)
$ 3,382.7
Capitalized transaction costs
32.7
Total consideration paid to effect the Acquisition
3,415.4
Net assets acquired at historical cost
821.9
Adjustments to state acquired assets at fair value:
1) Increase carrying value of merchandise inventories $ 129.6
2) Increase carrying value of property and equipment 457.7
3) Revalue intangible assets:
Tradenames 739.3
Other definite-lived intangible assets, primarily customer lists 492.1
Favorable lease commitments 799.8
4) Change in carrying values of other assets and liabilities (67.0)
5) Write-off historical deferred lease credits 102.3
6) Write-off historical debt issuance costs (31.3)
7) Write-off historical goodwill (1,263.4)
8) Settlement of unvested Predecessor stock options (Note 12) 51.5
9) Tax impact of valuation adjustments and other tax benefits (965.7)
Total adjustments to state acquired assets at fair value
444.9
Net assets acquired at fair value
1,266.8
Excess purchase price related to the Acquisition recorded as goodwill
$ 2,148.6
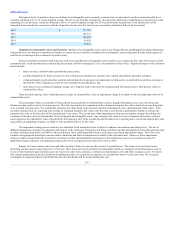
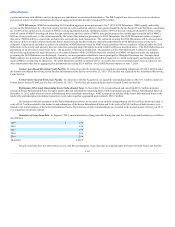
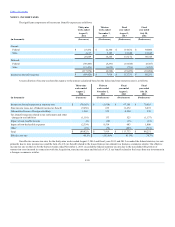
Pro Forma Financial Information. The following unaudited pro forma results of operations assume that the Acquisition occurred on July 29, 2012.
This unaudited pro forma information should not be relied upon as necessarily being indicative of the historical results that would have been obtained if the
Acquisition had actually occurred on that date, nor the results that may be obtained in the future.
Revenues
$ 4,839,331
$ 4,648,249
Net earnings (loss)
36,501
(118,315)
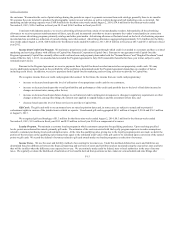
Pro forma adjustments for fiscal year 2014 consist primarily of 1) the reversal of $162.7 million of transaction costs incurred in connection with the
Acquisition, 2) the reversal of the historical non-cash charges of $129.6 million to cost of goods sold related to the sale of our acquired inventories that were
valued at their fair values as of the Acquisition date and 3) adjustments to depreciation and amortization charges aggregating $26.5 million, partially offset
by 4) interest expense of $29.8 million.
Pro forma adjustments for fiscal year 2013 consist primarily of 1) depreciation and amortization charges aggregating $159.8 million, 2) interest
expense of $130.9 million and 3) non-cash charges of $129.6 million to cost of goods sold related to the step-up in carrying value of our inventories as of the
Acquisition date.
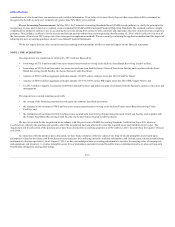
Fair value is the price that would be received upon sale of an asset or paid upon transfer of a liability in an orderly transaction between market
participants at the measurement date and in the principal or most advantageous market for that asset or liability. Assets and liabilities are classified using a
fair value hierarchy that prioritizes the inputs to valuation techniques used to measure fair value as follows:
F-17