Neiman Marcus 2013 Annual Report Download - page 28
Download and view the complete annual report
Please find page 28 of the 2013 Neiman Marcus annual report below. You can navigate through the pages in the report by either clicking on the pages listed below, or by using the keyword search tool below to find specific information within the annual report.-
 1
1 -
2
-
3
-
4
-
5
-
6
-
7
-
8
-
9
-
10
-
11
-
12
-
13
-
14
-
15
-
16
-
17
-
 18
18 -
 19
19 -
 20
20 -
 21
21 -
 22
22 -
 23
23 -
 24
24 -
 25
25 -
 26
26 -
 27
27 -
 28
28 -
 29
29 -
 30
30 -
 31
31 -
 32
32 -
 33
33 -
 34
34 -
 35
35 -
 36
36 -
 37
37 -
 38
38 -
39
-
40
-
41
-
42
-
43
-
44
-
45
-
46
-
47
-
48
-
49
-
50
-
51
-
52
-
53
-
54
-
55
-
56
-
57
-
58
-
59
-
60
-
61
-
62
-
63
-
64
-
65
-
66
-
67
-
68
-
69
-
70
-
71
-
72
-
73
-
74
-
75
-
76
-
77
-
78
-
79
-
80
-
81
-
82
-
83
-
84
-
85
-
86
-
87
-
88
-
89
-
90
-
91
-
92
-
93
-
94
-
95
-
96
-
97
-
98
-
99
-
100
-
101
-
102
-
103
-
104
-
105
-
106
-
107
-
108
-
109
-
110
-
111
-
112
-
113
-
114
-
115
-
116
-
117
-
118
-
119
-
120
-
121
-
122
-
123
-
124
-
125
-
126
-
127
-
128
-
129
-
130
-
131
-
132
-
133
-
134
-
135
-
136
-
137
-
138
-
139
-
140
-
141
-
142
-
143
-
144
-
145
-
146
-
147
-
148
-
149
-
150
-
151
-
152
-
153
-
154
-
155
-
156
-
157
-
158
-
159
-
160
-
161
-
162
-
163
-
164
-
165
-
166
-
167
-
168
-
169
-
170
-
171
-
172
-
173
-
174
-
175
-
176
-
177
-
178
-
179
-
180
-
181
-
182
-
183
-
184
-
185
-
186
-
187
-
188
-
189
-
190
-
191
-
192
-
193
-
194
-
195
-
196
-
197
-
198
-
199
-
200
-
201
-
202
-
203
 |
 |

Table of Contents
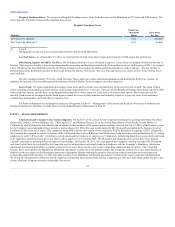
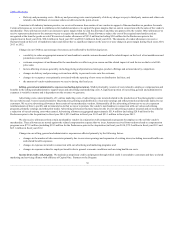
The following selected financial data is qualified in entirety by our Consolidated Financial Statements (and the Notes thereto) contained in Item 15
and should be read in conjunction with “Management’s Discussion and Analysis of Financial Condition and Results of Operations” in Item 7.
Cash and cash equivalents $ 196.5
$ 136.7
$ 49.3
$ 321.6
$ 421.0
Merchandise inventories 1,069.6
1,018.8
939.8
839.3
790.5
Total current assets 1,409.8
1,286.0
1,143.7
1,302.7
1,360.1
Property and equipment, net 1,390.3
901.8
894.5
873.2
905.8
Total assets 8,761.7
5,300.2
5,201.9
5,364.8
5,532.3
Total current liabilities 856.7
776.7
725.2
662.2
662.5
Long-term debt, excluding current
maturities 4,580.5
2,697.1
2,781.9
2,681.7
2,879.7
Cash dividends per share $ —
$ —
$ 435.0
$ —
$ —
Revenues $ 3,710.2
$ 1,129.1
$ 4,648.2 $ 4,345.4
$ 4,002.3 $ 3,692.8
Cost of goods sold including buying
and occupancy costs (excluding
depreciation) 2,563.3
685.4
2,995.4 2,794.7
2,589.3 2,417.6
Selling, general and administrative
expenses (excluding depreciation) 840.5
266.5
1,047.8 1,006.9
924.3 878.1
Income from credit card program (40.7)
(14.7)
(53.4)
(51.6)
(46.0)
(59.1)
Depreciation and amortization 262.0
46.0
188.9 180.2
194.9 215.1
Operating earnings 8.8 (2)
32.1 (3) 446.4 403.6
329.7 231.8
(Loss) earnings before income taxes (223.9) (2)
(5.2)
277.4 (4) 228.3
49.3 (5) (5.3)
Net (loss) earnings $ (134.1) (2)
$ (13.1)
$ 163.7 (4) $ 140.1
$ 31.6 (5) $ (1.8)
27