Neiman Marcus 2013 Annual Report Download - page 29
Download and view the complete annual report
Please find page 29 of the 2013 Neiman Marcus annual report below. You can navigate through the pages in the report by either clicking on the pages listed below, or by using the keyword search tool below to find specific information within the annual report.-
 1
1 -
2
-
3
-
4
-
5
-
6
-
7
-
8
-
9
-
10
-
11
-
12
-
13
-
14
-
15
-
16
-
17
-
18
-
 19
19 -
 20
20 -
 21
21 -
 22
22 -
 23
23 -
 24
24 -
 25
25 -
 26
26 -
 27
27 -
 28
28 -
 29
29 -
 30
30 -
 31
31 -
 32
32 -
 33
33 -
 34
34 -
 35
35 -
 36
36 -
 37
37 -
 38
38 -
 39
39 -
40
-
41
-
42
-
43
-
44
-
45
-
46
-
47
-
48
-
49
-
50
-
51
-
52
-
53
-
54
-
55
-
56
-
57
-
58
-
59
-
60
-
61
-
62
-
63
-
64
-
65
-
66
-
67
-
68
-
69
-
70
-
71
-
72
-
73
-
74
-
75
-
76
-
77
-
78
-
79
-
80
-
81
-
82
-
83
-
84
-
85
-
86
-
87
-
88
-
89
-
90
-
91
-
92
-
93
-
94
-
95
-
96
-
97
-
98
-
99
-
100
-
101
-
102
-
103
-
104
-
105
-
106
-
107
-
108
-
109
-
110
-
111
-
112
-
113
-
114
-
115
-
116
-
117
-
118
-
119
-
120
-
121
-
122
-
123
-
124
-
125
-
126
-
127
-
128
-
129
-
130
-
131
-
132
-
133
-
134
-
135
-
136
-
137
-
138
-
139
-
140
-
141
-
142
-
143
-
144
-
145
-
146
-
147
-
148
-
149
-
150
-
151
-
152
-
153
-
154
-
155
-
156
-
157
-
158
-
159
-
160
-
161
-
162
-
163
-
164
-
165
-
166
-
167
-
168
-
169
-
170
-
171
-
172
-
173
-
174
-
175
-
176
-
177
-
178
-
179
-
180
-
181
-
182
-
183
-
184
-
185
-
186
-
187
-
188
-
189
-
190
-
191
-
192
-
193
-
194
-
195
-
196
-
197
-
198
-
199
-
200
-
201
-
202
-
203
 |
 |

Table of Contents
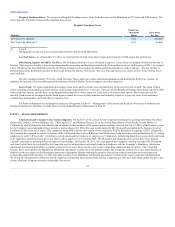
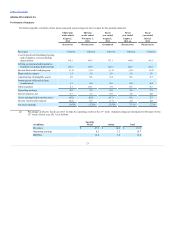
Net capital expenditures (6) $ 132.3
$ 36.0
$ 139.3
$ 142.2
$ 83.7
$ 44.3
Depreciation expense 113.3
34.2
141.5
130.1
132.4
141.8
Rent expense and related occupancy
costs 79.6
24.1
96.7
91.9
87.6
85.0
Change in comparable revenues (7) 5.4%
5.7%
4.9%
7.9%
8.1%
(0.1)%
Number of full-line stores open at
period end 43
43
43
44
43
43
Sales per square foot (8) $ 441
$ 138
$ 552
$ 535
$ 505
$ 466
EBITDA (9) $ 270.8 (2)
$ 78.1 (3) $ 635.3
$ 583.8
$ 524.7
$ 446.9
EBITDA as a percentage of revenues 7.3%
6.9%
13.7%
13.4%
13.1%
12.1 %
Adjusted EBITDA (9) $ 484.4
$ 193.2
$ 671.5
$ 603.1
$ 533.4
$ 460.3
Adjusted EBITDA as a percentage of
revenues 13.1%
17.1%
14.4%
13.9%
13.3%
12.5 %
(1) Fiscal year 2013 consists of the fifty-three weeks ended August 3, 2013. All other fiscal years presented consist of fifty-two weeks.
(2) For the thirty-nine weeks ended August 2, 2014, operating earnings and EBITDA include other expenses of $76.3 million primarily due to
transaction costs related to the Acquisition and the investigation of the Cyber-Attack.
For the thirty-nine weeks ended August 2, 2014, loss before income taxes and net loss include a loss on debt extinguishment of $7.9 million, which
primarily consists of the write-off of debt issuance costs incurred in connection with the initial issuance of the Senior Secured Term Loan Facility
allocable to lenders that no longer participate in the Senior Secured Term Loan Facility subsequent to the refinancing. The total loss on debt
extinguishment was recorded as a component of interest expense.
(3) For the thirteen weeks ended November 2, 2013, operating earnings and EBITDA include other expenses of $113.7 million primarily due to
transaction costs related to the Acquisition.
(4) For fiscal year 2013, earnings before income taxes and net earnings include a loss on debt extinguishment of $15.6 million, which included 1) costs
of $10.7 million related to the tender for and redemption of our Senior Subordinated Notes and 2) the write-off of $4.9 million of debt issuance costs
related to the extinguished debt facilities. The total loss on debt extinguishment was recorded as a component of interest expense.
(5) For fiscal year 2011, earnings before income taxes and net earnings include a loss on debt extinguishment of $70.4 million, which included 1) costs
of $37.9 million related to the tender for and redemption of our Senior Notes and 2) the write-off of $32.5 million of debt issuance costs related to
the extinguished debt facilities. The total loss on debt extinguishment was recorded as a component of interest expense.
(6) Amounts are net of developer contributions of $5.7 million, $0.0 million, $7.2 million, $10.6 million, $10.5 million and $14.4 million, respectively,
for the periods presented.
(7) Comparable revenues include 1) revenues derived from our retail stores open for more than fifty-two weeks, including stores that have been
relocated or expanded and 2) revenues from our online operation. Comparable revenues exclude revenues of closed stores. We closed our Neiman
Marcus store in Minneapolis in January 2013. The calculation of the change in comparable revenues for fiscal year 2013 is based on revenues for
the fifty-two weeks ended July 27, 2013 compared to revenues for the fifty-two weeks ended July 28, 2012.
28