Neiman Marcus 2013 Annual Report Download - page 139
Download and view the complete annual report
Please find page 139 of the 2013 Neiman Marcus annual report below. You can navigate through the pages in the report by either clicking on the pages listed below, or by using the keyword search tool below to find specific information within the annual report.-
 1
1 -
2
-
3
-
4
-
5
-
6
-
7
-
8
-
9
-
10
-
11
-
12
-
13
-
14
-
15
-
16
-
17
-
18
-
19
-
20
-
21
-
22
-
23
-
24
-
25
-
26
-
27
-
28
-
29
-
30
-
31
-
32
-
33
-
34
-
35
-
36
-
37
-
38
-
39
-
40
-
41
-
42
-
43
-
44
-
45
-
46
-
47
-
48
-
49
-
50
-
51
-
52
-
53
-
54
-
55
-
56
-
57
-
58
-
59
-
60
-
61
-
62
-
63
-
64
-
65
-
66
-
67
-
68
-
69
-
70
-
71
-
72
-
73
-
74
-
75
-
76
-
77
-
78
-
79
-
80
-
81
-
82
-
83
-
84
-
85
-
86
-
87
-
88
-
89
-
90
-
91
-
92
-
93
-
94
-
95
-
96
-
97
-
98
-
99
-
100
-
101
-
102
-
103
-
104
-
105
-
106
-
107
-
108
-
109
-
110
-
111
-
112
-
113
-
114
-
115
-
116
-
117
-
118
-
119
-
120
-
121
-
122
-
123
-
124
-
125
-
126
-
127
-
128
-
 129
129 -
 130
130 -
 131
131 -
 132
132 -
 133
133 -
 134
134 -
 135
135 -
 136
136 -
 137
137 -
 138
138 -
 139
139 -
 140
140 -
 141
141 -
 142
142 -
 143
143 -
 144
144 -
 145
145 -
 146
146 -
 147
147 -
 148
148 -
 149
149 -
150
-
151
-
152
-
153
-
154
-
155
-
156
-
157
-
158
-
159
-
160
-
161
-
162
-
163
-
164
-
165
-
166
-
167
-
168
-
169
-
170
-
171
-
172
-
173
-
174
-
175
-
176
-
177
-
178
-
179
-
180
-
181
-
182
-
183
-
184
-
185
-
186
-
187
-
188
-
189
-
190
-
191
-
192
-
193
-
194
-
195
-
196
-
197
-
198
-
199
-
200
-
201
-
202
-
203
 |
 |

Table of Contents
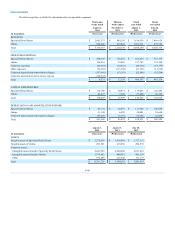
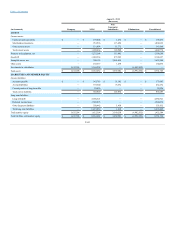
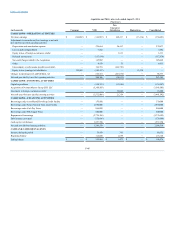
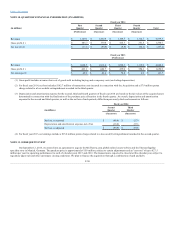
Current assets:
Cash and cash equivalents
$ —
$ 135,827
$ 849
$ —
$ 136,676
Merchandise inventories
—
909,332
109,507
—
1,018,839
Other current assets
—
117,313
13,149
—
130,462
Total current assets
—
1,162,472
123,505
—
1,285,977
Property and equipment, net
—
795,798
106,046
—
901,844
Goodwill
—
1,107,753
155,680
—
1,263,433
Intangible assets, net
—
245,756
1,536,392
—
1,782,148
Other assets
—
38,835
28,004
—
66,839
Investments in subsidiaries
831,038
1,845,022
—
(2,676,060)
—
Total assets
$ 831,038
$ 5,195,636
$ 1,949,627
$ (2,676,060)
$ 5,300,241
Current liabilities:
Accounts payable
$ —
$ 354,249
$ 32,289
$ —
$ 386,538
Accrued liabilities
—
319,358
70,810
—
390,168
Total current liabilities
—
673,607
103,099
—
776,706
Long-term liabilities:
Long-term debt
—
2,697,077
—
—
2,697,077
Deferred income taxes
—
639,381
—
—
639,381
Other long-term liabilities
—
354,533
1,506
—
356,039
Total long-term liabilities
—
3,690,991
1,506
—
3,692,497
Total stockholders’ equity
831,038
831,038
1,845,022
(2,676,060)
831,038
Total liabilities and stockholders’ equity
$ 831,038
$ 5,195,636
$ 1,949,627
$ (2,676,060)
$ 5,300,241
F-43